The Current State of Bitcoin: A Deep Dive
A Rollercoaster Ride
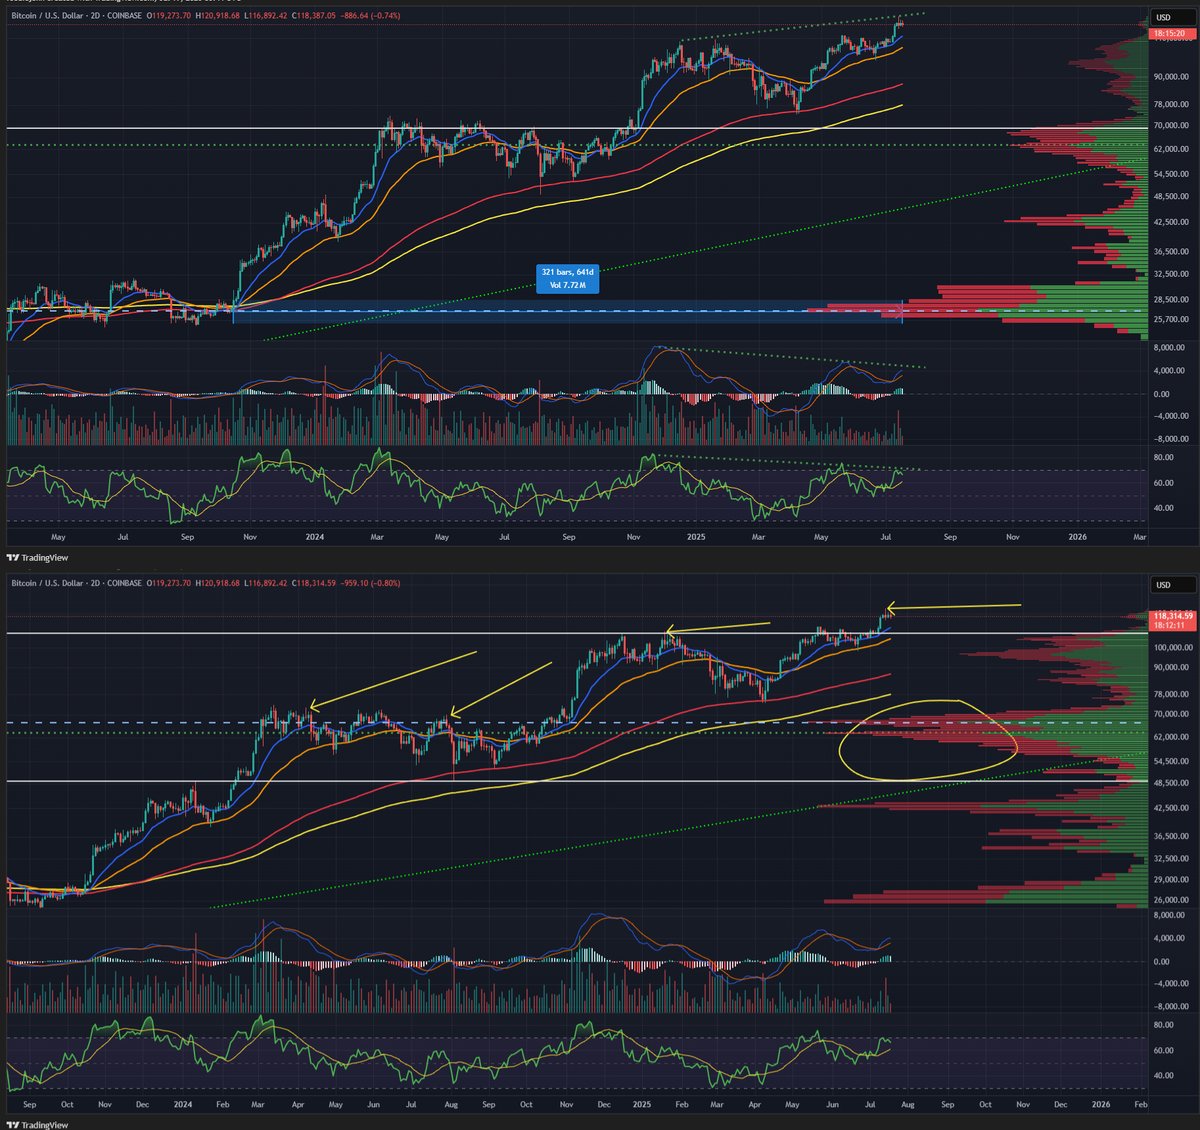
Imagine Bitcoin as a thrilling rollercoaster, its price chart tracing a dramatic journey through the digital frontier. Recent weeks have seen it hit a double bottom at $74,000, retest at $80,000, and now, it’s heading towards the $115,000 to $130,000 zone. While a retest at $80,000 is possible, the current momentum suggests otherwise[1].
Technical Analysis: A Closer Look
Harmonic Patterns and Indicators
On the 4-hour chart, a harmonic bat pattern is emerging, with the potential D leg aligning with the Fibonacci 0.886 level, corresponding to $86,800. This pattern, combined with a bearish engulfing candle, hints at a potential short-term correction. However, the overall trend remains bullish, with the 200-day moving average (200DMA) at $87,000 acting as a significant resistance level[2].
Support and Resistance Levels
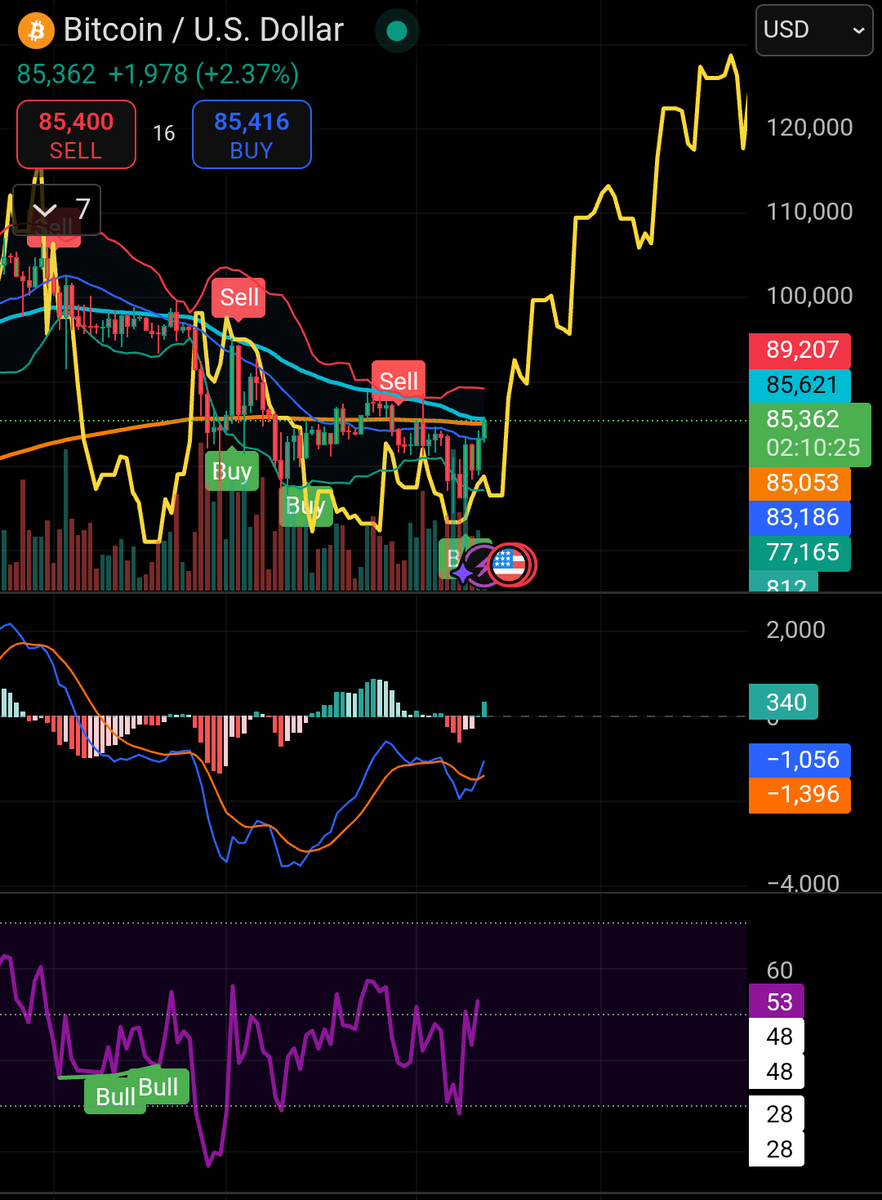
Bitcoin is currently holding above $80,000 after a volatile week. Key support is at $79,000, while resistance is near $83,500. The Relative Strength Index (RSI) shows neutral momentum, suggesting consolidation. Bulls need to break the 200DMA for a significant upside move. Traders should also keep an eye on tariff news, which could cause short-term price swings[3].
Innovations in Bitcoin’s Infrastructure
Layer 2 Solutions: Scaling Up
Exciting developments are happening in the world of Layer 2 solutions. Recent upgrades have boosted Bitcoin’s smart contract capabilities without compromising security. ColliderVM, for instance, introduces stateful computations, tackling scalability issues head-on. This leap forward is set to enhance Bitcoin’s speed and efficiency, making it more competitive in the ever-evolving crypto landscape[4].
NFTs: More Than Just Collectibles
The world of Bitcoin NFTs is also making waves. Projects like Legacy Ghosts are providing deep insights into Bitcoin NFT collections, focusing on rarity, history, and growth potential. These projects offer smart buy/sell recommendations based on real market trends, adding another layer of utility to the Bitcoin ecosystem[5].
The Broader Crypto Market
USDT Dominance: A Tell-Tale Sign
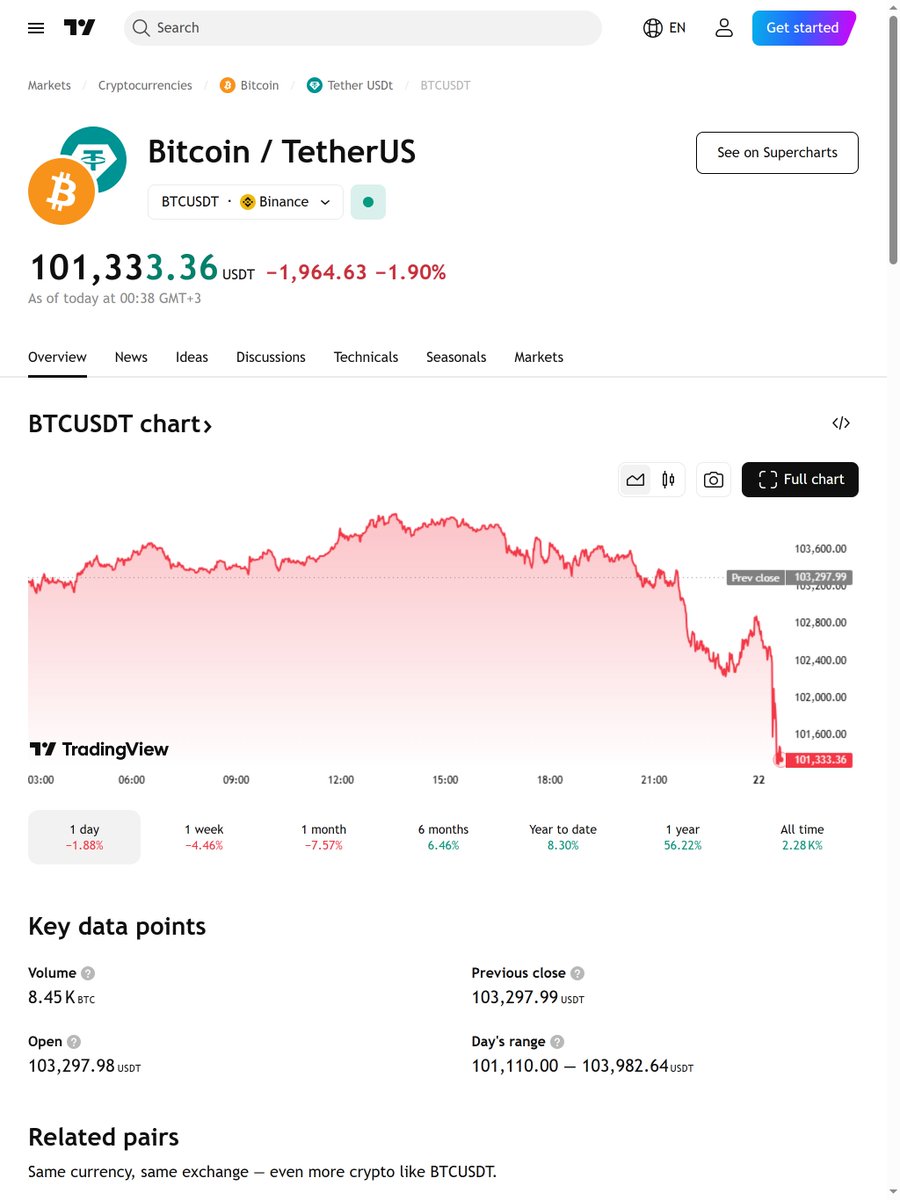
The dominance of Tether (USDT) in the crypto market is currently below 5.77%, at 5.44%. An upsloping trendline from January 20th with seven touches suggests that a break below this trendline could signal a rally in the broader crypto market. This could be a bullish sign for Bitcoin and other cryptocurrencies[6].
Market Sentiment: Cautiously Optimistic
The overall market sentiment is cautiously optimistic. While there are signs of consolidation, the underlying strength of Bitcoin and the innovative developments in its infrastructure point to a bright future. However, traders should remain vigilant and keep an eye on key indicators and news events that could impact the market.
Conclusion: The Future of Bitcoin
As we stand at the edge of this digital cliff, looking out at the vast expanse of possibilities, one thing is clear: Bitcoin is far from done evolving. With innovative Layer 2 solutions, a thriving NFT ecosystem, and a market that is poised for growth, the future of Bitcoin is bright. So, buckle up and get ready for the ride, because the best is yet to come.
[1]: Metal Sam’s Bitcoin Analysis
[2]: Never Lose Trader’s Harmonic Pattern Analysis
[3]: Altcoins Daily News Bitcoin Price Prediction
[4]: Bitcoin Layer 2 Insights
[5]: Sniffler Analysis on BUTTCOIN
[6]: TommyCrow’s Crypto & Market Analysis