Bitcoin’s Bearish Trend: A Detailed Analysis
The Bitcoin Rollercoaster
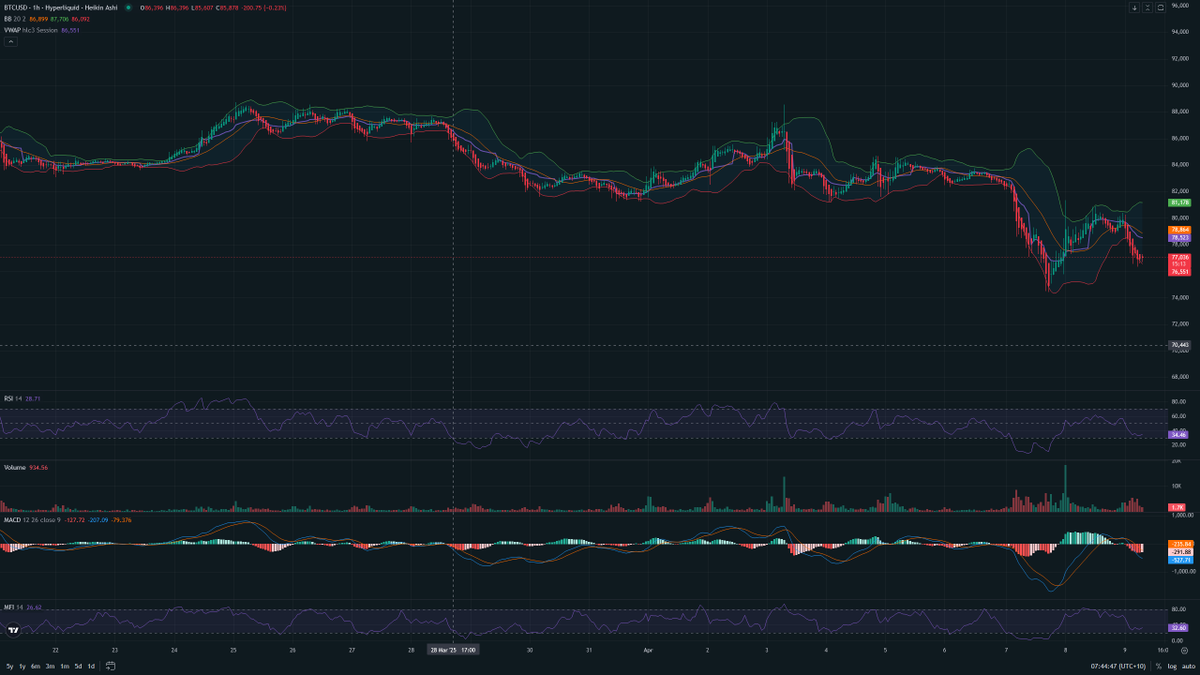
Imagine Bitcoin as a rollercoaster, with investors as the thrill-seekers. Lately, it’s been a bumpy ride, with the cryptocurrency giant experiencing a strong downtrend. The Relative Strength Index (RSI) is oversold at 28, and the Moving Average Convergence Divergence (MACD) is flashing bearish signals. Support is holding at $77,500, but resistance looms at $80,000. Short entries are being considered, with stop losses at $79,500 and targets at $76,500. It’s a volatile market, and Bitcoin is currently facing headwinds.
Technical Analysis: The Bearish Narrative
The Death Cross: Fact or Fiction?
The ‘death cross’ is looming, a technical signal that often precedes price drops. It occurs when a short-term moving average crosses below a long-term moving average, indicating a bearish trend. However, CoinShares, a crypto asset management firm, isn’t buying the hype. They argue that the death cross isn’t as dire as it seems, and Bitcoin’s fundamentals remain strong [1]. But markets are fickle, and technical indicators can sway investor sentiment like a pendulum.
Money Supply: Bitcoin’s Unseen Friend?
Research suggests a correlation between the global M2 money supply and Bitcoin’s price. With the M2 money supply currently at $90.219 trillion USD and Bitcoin at $79,000, a rally could be plausible [2]. However, markets are complex puzzles, and fractal predictions aren’t guaranteed. The money supply-Bitcoin price relationship is just one piece of the puzzle.
The Broader Market Landscape
Macro Conditions: The Elephant in the Room
Macroeconomic conditions and recession fears are finally casting long shadows, something market observers have been warning about since 2021. These broader economic factors can significantly impact Bitcoin’s price, as investors seek safe havens during uncertainty. The current bearish trend could be a reflection of these macroeconomic concerns [3].
Altcoin Season: Bitcoin’s New Rival?
The altcoin season is in full swing, with investors turning their attention away from Bitcoin. This shift can often lead to a decrease in Bitcoin’s price, as investors sell their holdings to invest in other projects. But remember, Bitcoin is still the king of cryptocurrencies, and its price movements can often set the tone for the rest of the market.
Technical Indicators: Friends or Foes?
RSI and MACD: Bearish Buddies?
The RSI and MACD are two of the most widely used technical indicators. The RSI measures price movement speed and change, while the MACD is a trend-following momentum indicator. In the current market, the RSI is oversold at 28, and the MACD is indicating a bearish cross. These indicators suggest that Bitcoin’s price could continue to fall in the short term [4].
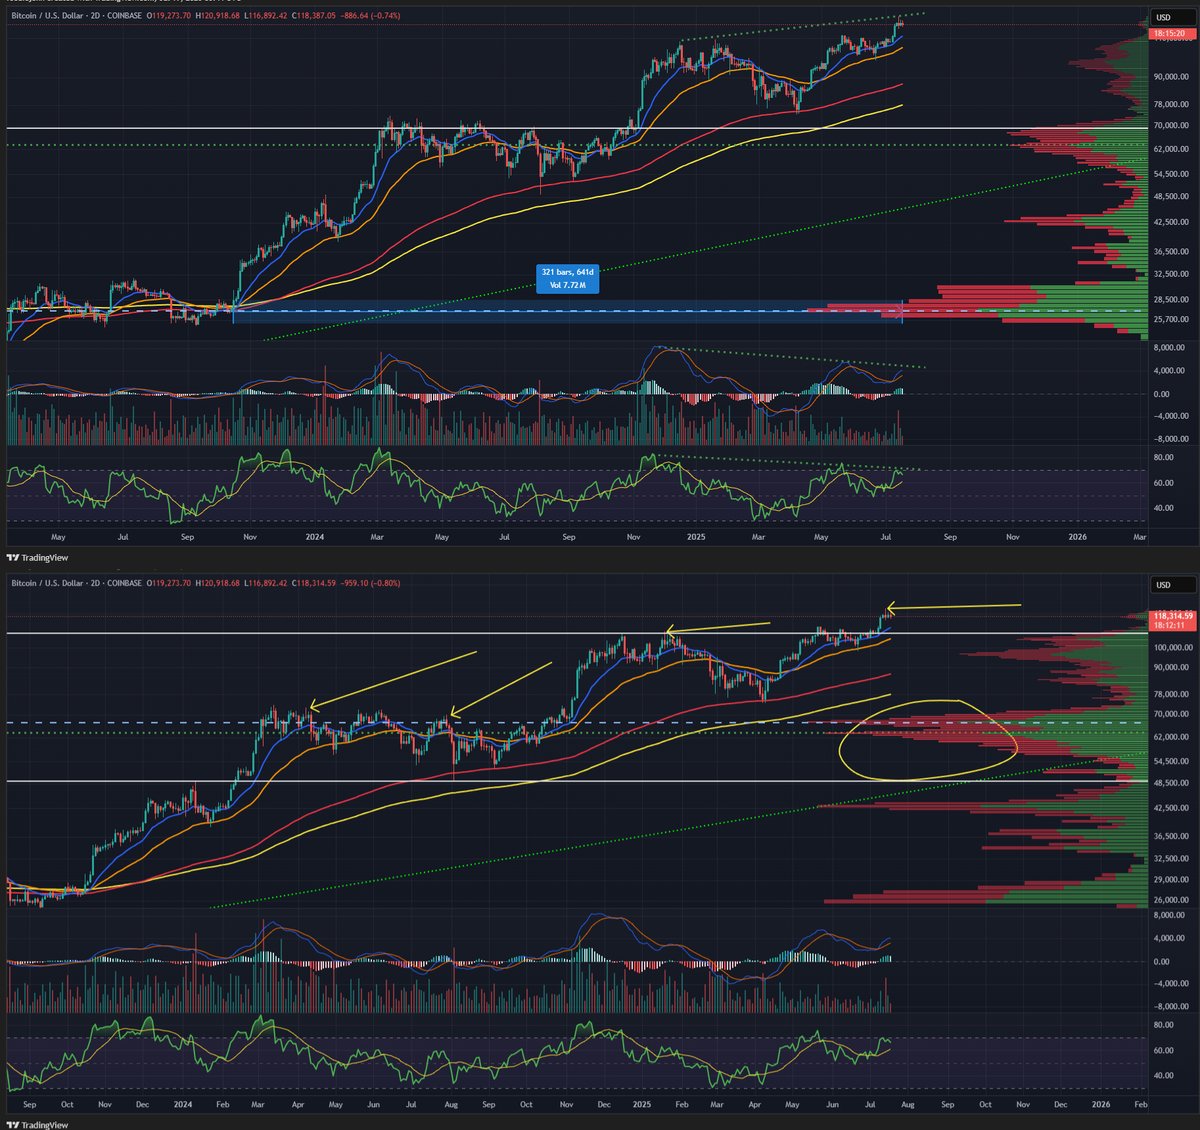
Support and Resistance: The Market’s Gatekeepers
Support and resistance levels are crucial in technical analysis. Currently, support is holding at $77,500, with resistance at $80,000. These levels can act as barriers to price movements, preventing further declines (support) or gains (resistance). In the current bearish trend, these levels are crucial to watch. A break below support could signal further declines [5].
The Bitcoin Rally: A Glimmer of Hope?
The Potential for a Turnaround
Despite the current bearish trend, there’s still potential for a Bitcoin rally. The correlation between the global M2 money supply and Bitcoin’s price suggests a rally is plausible, backed by historical patterns. However, markets are complex, and predictions aren’t guaranteed.
Investor Sentiment: The Market’s Mood Ring
Investor sentiment plays a crucial role in the cryptocurrency market. The current bearish trend could be a reflection of negative sentiment. But sentiment can change quickly, and a shift in investor outlook could lead to a Bitcoin rally. Stay informed and adapt to changing market conditions [6].
Conclusion: Navigating the Bearish Trend
In the end, the bearish trend in Bitcoin is a reflection of the market’s complex and ever-changing nature. Technical indicators, macroeconomic factors, and investor sentiment all shape Bitcoin’s price movements. As investors, it’s crucial to stay informed, adapt to changing market conditions, and remain vigilant in the face of uncertainty. The market may be volatile, but with the right tools and mindset, investors can navigate the rollercoaster and emerge stronger on the other side.
Sources