
Bitcoin’s Wild Ride: Where Could It Be Heading Next?
Bitcoin, the first and most famous cryptocurrency, has been on a rollercoaster ride lately. After reaching a record high of nearly $109,300, Bitcoin took a big dip, falling over 21% to about $87,534 by late February 2025[3]. This sudden drop has sparked a lot of talk among experts about where Bitcoin might go next. Let’s dive into the current market situation and look at two important charts that might give us some clues.
What’s Happening in the Market Right Now
Bitcoin’s Price Drop
Bitcoin’s recent price drop has been caused by several things. Some big worries in the world economy and politics are making people nervous, and that’s affecting the price of Bitcoin[3]. Also, people have been taking their money out of Bitcoin ETFs, which is making the price go down[3].
Technical Analysis: The Wyckoff Model
Some experts who study the charts are looking at something called the Wyckoff reaccumulation model. This model suggests that Bitcoin might be getting ready for another big jump, like the one it had in August 2024 that made the price go up by 40%[3]. But this model also shows that Bitcoin is currently in a “Test” phase, which means it’s trying to stay above a certain price level[3].
Where Could Bitcoin Be Headed? Let’s Look at the Charts
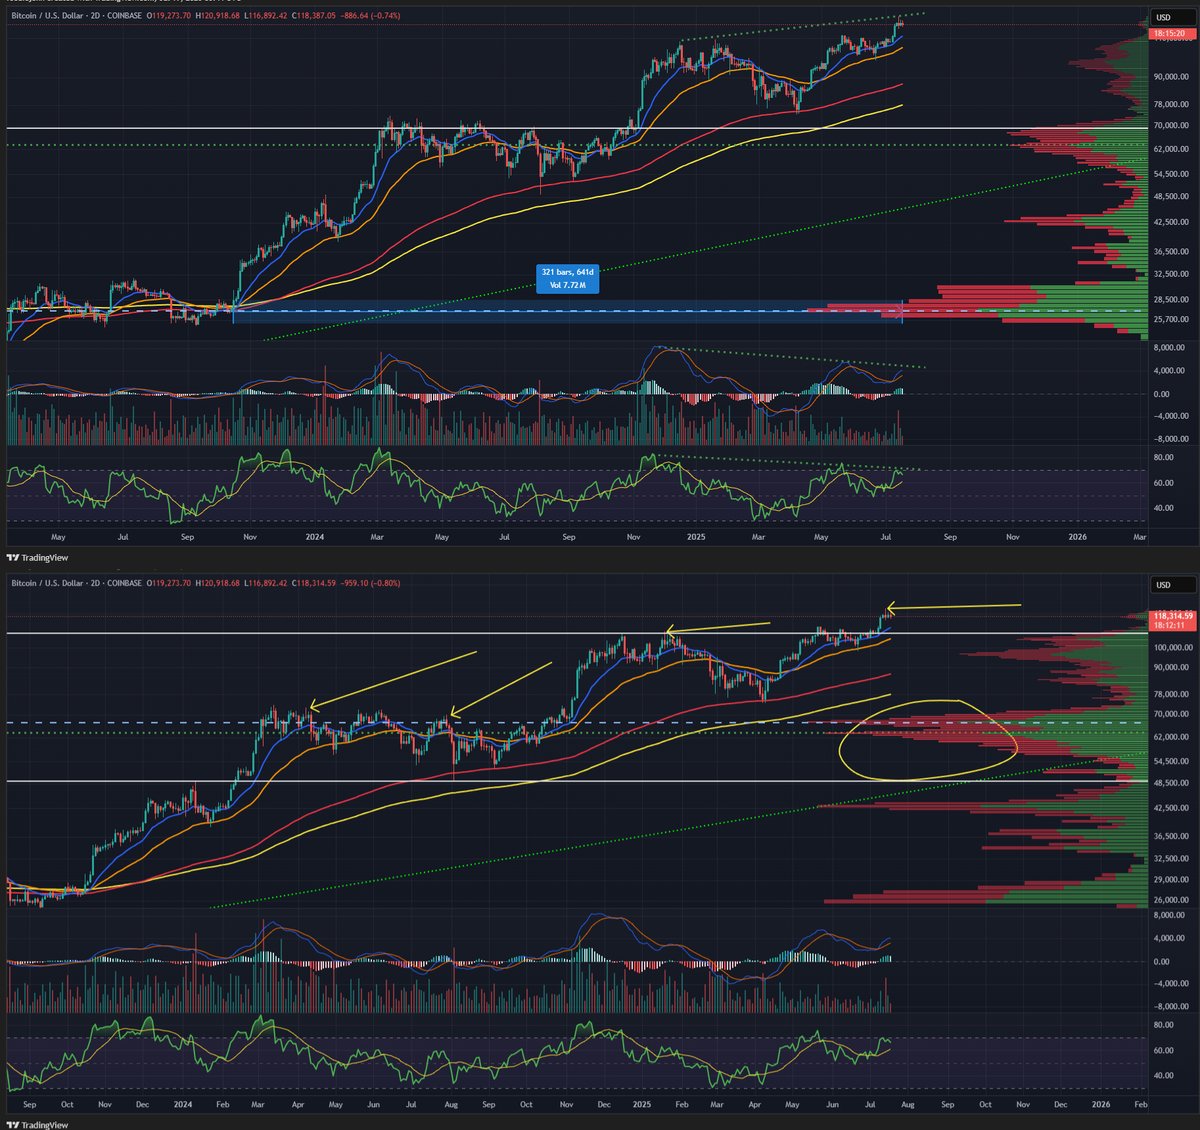
Chart 1: Support Levels and Resistance
The first chart shows Bitcoin’s most important support and resistance levels. Right now, Bitcoin is having a hard time staying above the $86,813.41 support level[5]. If it can’t stay above this level, it might drop even more and test the $81,502.03 support level[5]. But if buyers start buying more Bitcoin, it might be able to break through the $88,972.37 resistance level and start to recover[5].
Chart 2: MACD and RSI Indicators
The second chart shows two important indicators: Moving Average Convergence Divergence (MACD) and Relative Strength Index (RSI). These tools help us see what might happen to Bitcoin in the short term. Recently, we’ve seen something called “death crosses” and “golden crosses” on the MACD line, which means that the price of Bitcoin might go up or down[5]. The RSI has also shown that Bitcoin has been oversold, which sometimes leads to a brief recovery[5].
What’s Next for Bitcoin?
As Bitcoin goes through this tough time, everyone is watching to see if it will get better or if the price will drop even more. The charts show that Bitcoin’s immediate future depends on whether it can stay above certain price levels and how the world economy changes. Only time will tell if Bitcoin will try to reach $100,000 again or if it will have a bigger drop. One thing is for sure: the road ahead will be full of ups and downs!