The Enigma of Bitcoin: Unraveling the Current Technical Landscape
Imagine navigating a ship through stormy seas. The waves represent the volatile market, and the stars above are the technical indicators guiding your path. Welcome to the world of Bitcoin, where every day brings new challenges and opportunities. As of June 17, 2025, Bitcoin finds itself in a complex dance of technical indicators and market sentiments. Let’s embark on a journey to understand the current state of Bitcoin, exploring the technical analyses and market dynamics that are shaping its future.
The Technical Landscape
Consolidation and Support Levels
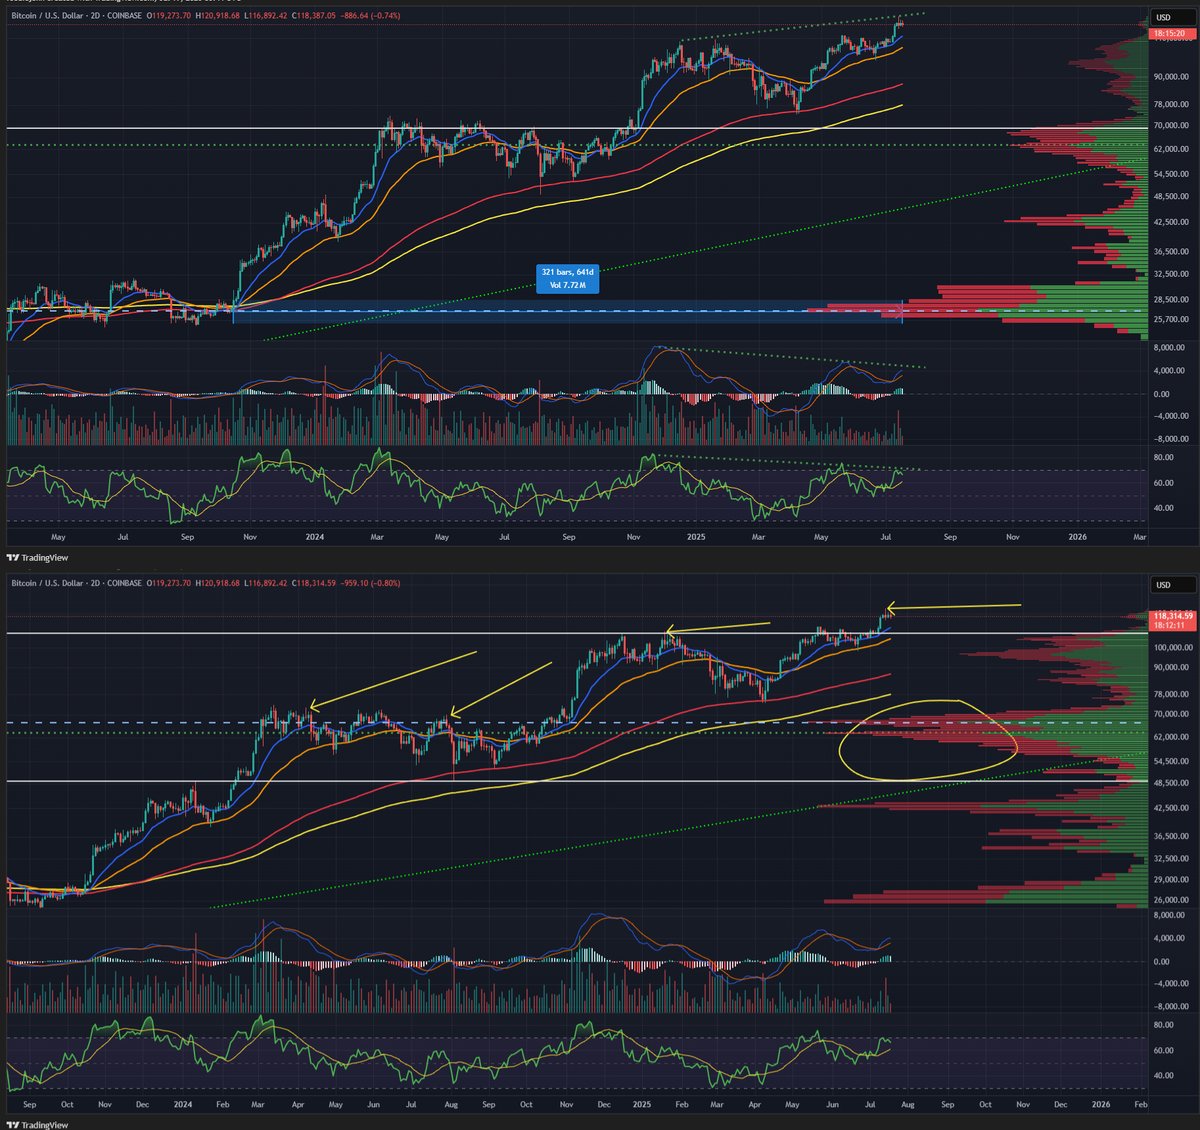
Bitcoin is currently in a phase of consolidation, forming an ascending triangle pattern. This pattern is like a coiled spring, ready to release energy in either direction. The horizontal resistance level and the upward sloping support trendline create a battleground for bulls and bears. The price is trading above both the support trendline and the Ichimoku Cloud, which adds an extra layer of support. This consolidation is a pivotal moment, as a breakout above the resistance could signal a bullish trend, while a breakdown below the support could indicate a bearish reversal.
Short-Term Bearish Momentum
Zooming in on shorter timeframes, the momentum indicators are flashing bearish signals. The Moving Average Convergence Divergence (MACD) on the 5-minute chart shows a bearish crossover, indicating short-term selling pressure. The Relative Strength Index (RSI) is oversold on the 1-hour and 6-hour charts, suggesting that a bounce might be on the horizon. However, the bearish momentum is persistent across multiple timeframes, hinting at a possible deeper correction.
Fibonacci Retracement Levels
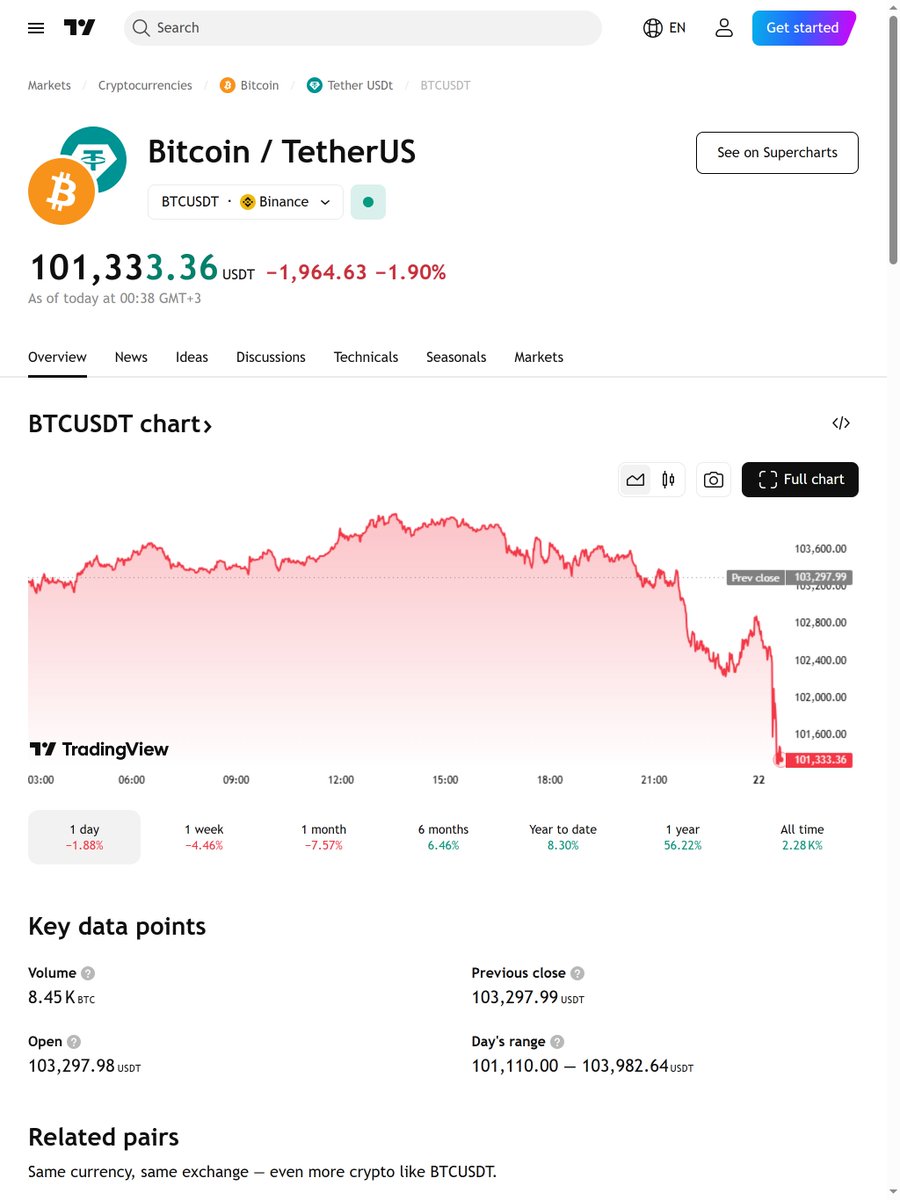
Bitcoin is testing the 0.786 Fibonacci retracement level near $103,000. This level is a significant battleground, often acting as a strong support or resistance zone. If Bitcoin can reclaim the $106,000 level, it has the potential for a bullish breakout toward $117,565. However, a breakdown below $102,703 could negate this setup and lead to further downside movement. The Fibonacci levels are like the compass on our ship, guiding us through the stormy seas of market volatility.
Market Sentiment and External Factors
Institutional Interest
Despite the technical indicators painting a mixed picture, there is strong institutional interest in Bitcoin. Institutional investors view Bitcoin as a hedge against inflation and a store of value, similar to gold. This interest can provide a safety net for the price, even during periods of technical weakness. The current geopolitical tensions in the Middle East have not significantly impacted Bitcoin’s price action, indicating that institutional investors are maintaining their positions. This stability is like the lighthouse guiding our ship through the fog of market uncertainty.
Astrological Influences
Some analysts consider astrological factors in their market analysis. For instance, the Mars/Venus opposition on June 17, 2025, was noted as a potential source of volatility. While astrology is not a traditional tool in financial analysis, it can provide additional insights into market sentiment and potential turning points. Think of astrology as the ancient mariners’ stars, offering a different perspective on the market’s journey.
The Road Ahead
Potential Scenarios
Key Levels to Watch
– Support: $102,703, $103,000 (0.786 Fib retracement)
– Resistance: $106,000, $117,565 (bullish target)
– Key Indicators: MACD, RSI, Ichimoku Cloud, Fibonacci retracement levels
Conclusion: Navigating the Uncertainty
Bitcoin’s current technical landscape is a mix of consolidation, bearish momentum, and strong institutional support. As investors navigate this uncertainty, it is crucial to stay informed and adaptable. The next directional move will likely be confirmed by a breakout or breakdown from the ascending triangle pattern. Whether Bitcoin continues its bullish trend or enters a deeper correction, the key levels and indicators discussed will play a pivotal role in shaping its future trajectory. Stay vigilant, stay informed, and most importantly, stay adaptable in the ever-changing world of cryptocurrency. The journey of Bitcoin is far from over, and the next chapter is waiting to be written.