The Intricate Dance of Bitcoin
Introduction: The Ever-Changing Landscape
In the dynamic world of cryptocurrency, Bitcoin remains the undisputed king, shaping market trends and capturing the attention of investors and analysts alike. As of June 17, 2025, Bitcoin finds itself at a pivotal moment, with market sentiments and technical indicators painting a complex picture. This report aims to unravel the intricacies of Bitcoin’s current state, exploring the interplay of emotions, technical analysis, and external factors that influence its trajectory.
The Emotional Rollercoaster
Greed and Fear: The Dual Forces
Cryptocurrency markets are infamous for their volatility, largely driven by the emotions of greed and fear. Greed often fuels rapid price surges as traders chase profits, believing that the upward momentum will continue indefinitely. On the other hand, fear can trigger abrupt sell-offs, leading to sharp price declines as panic takes hold.
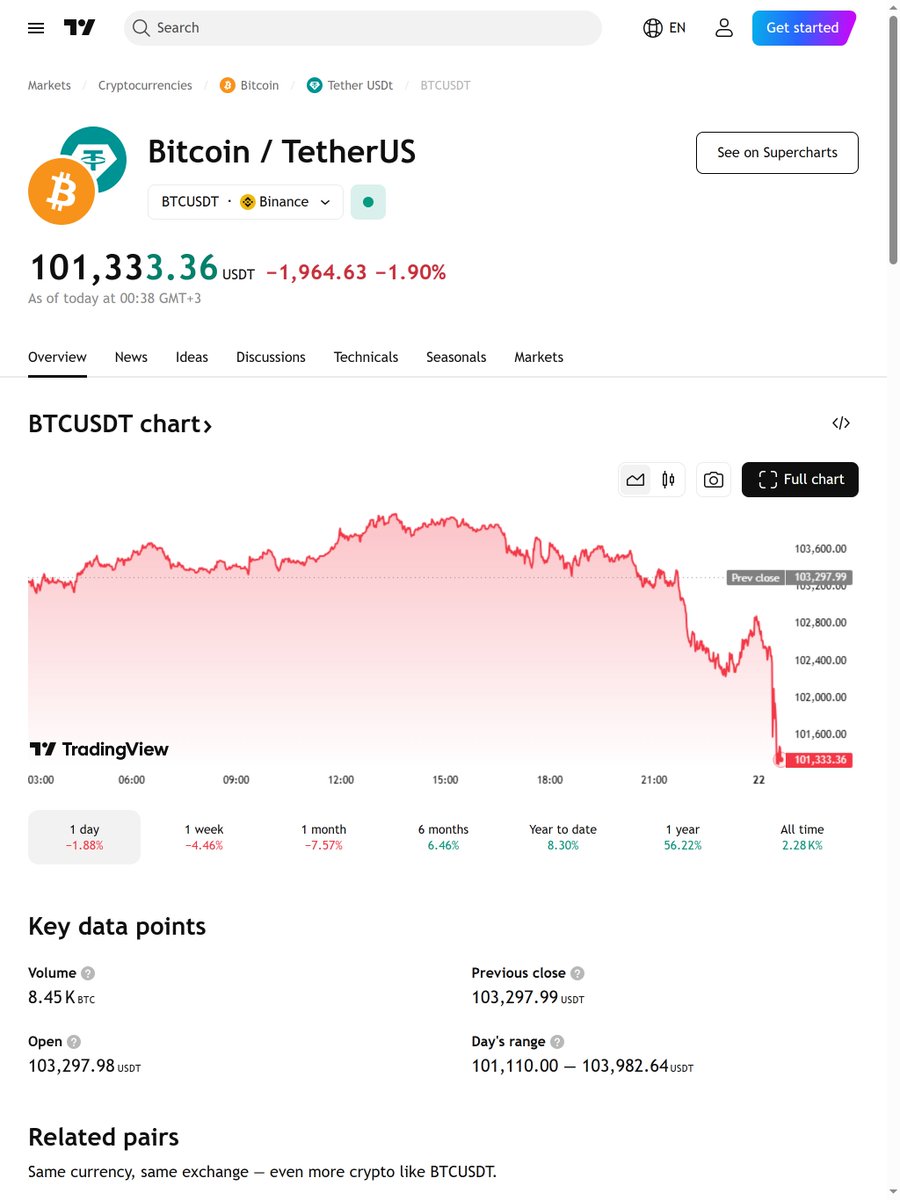
Bitcoin’s recent price movements exemplify this emotional tug-of-war. The digital currency has been oscillating around the $106,000 mark, with technical indicators providing conflicting signals. The Relative Strength Index (RSI) hitting oversold levels suggests a potential bounce, while bearish divergence indicates ongoing selling pressure. This emotional volatility underscores the need for a balanced and informed approach to trading.
The Role of AI in Trading
Amidst this emotional turmoil, artificial intelligence (AI) has emerged as a stabilizing force. AI-driven trading platforms, such as Scorehood Bull::Bear Analysis App, offer a data-driven approach to navigating the volatile crypto landscape. By leveraging AI, traders can mitigate the impact of emotions, making more informed and strategic decisions. This shift towards AI trading is not just a trend but a necessity in an increasingly complex and fast-paced market.
Technical Analysis: Deciphering the Charts
Bollinger Bands and RSI
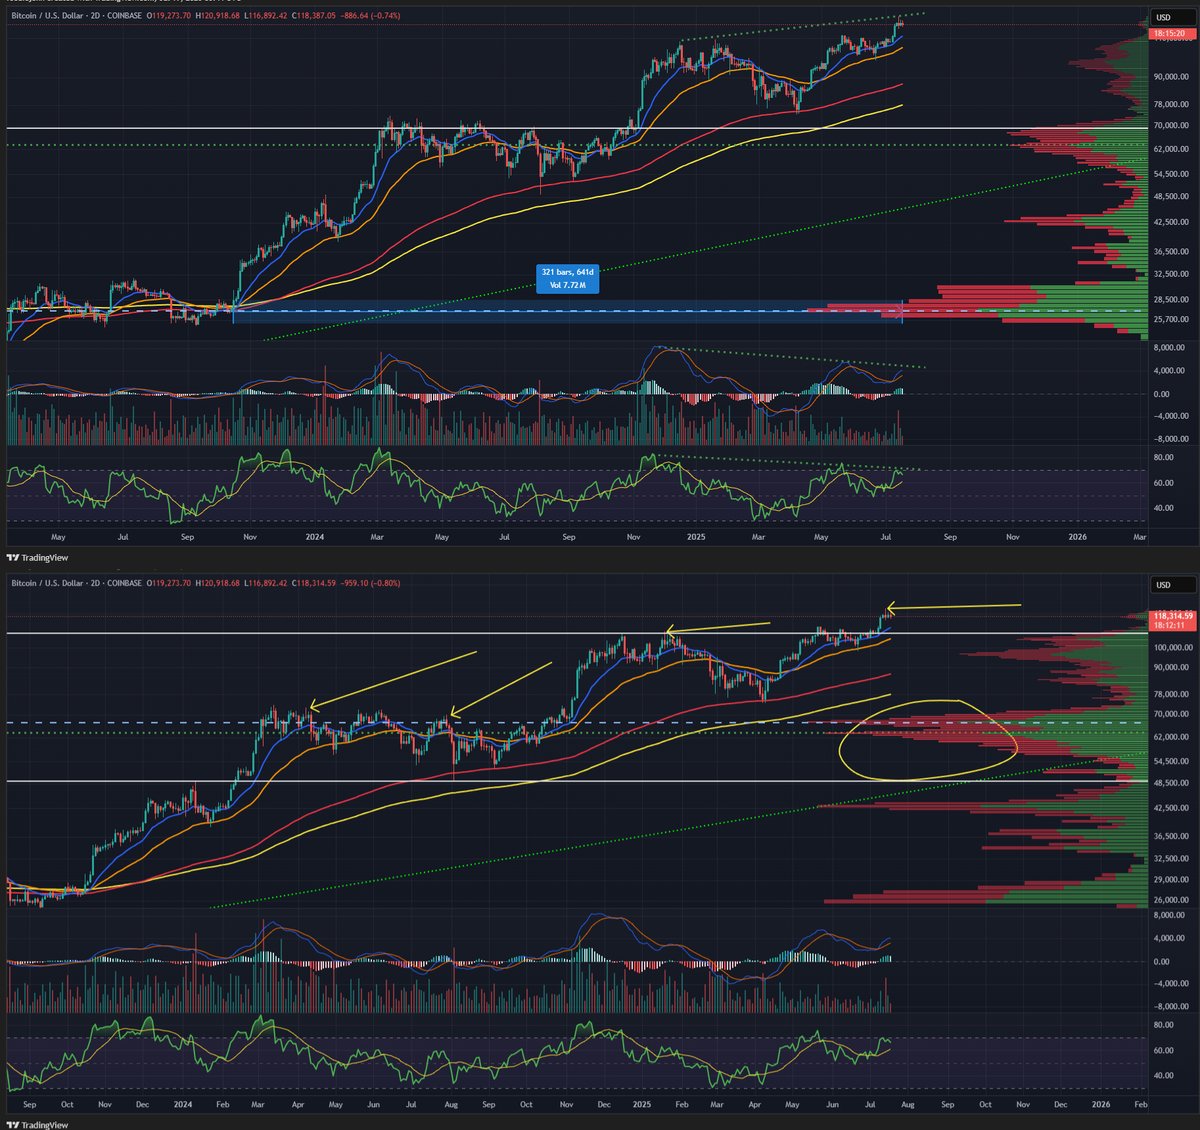
One of the key tools in a trader’s arsenal is the Bollinger Band, which helps identify volatility and potential reversal points. Bitcoin’s recent interaction with the lower Bollinger Band, coupled with RSI hitting oversold levels, has sparked debates about an imminent bounce. The $106,000 zone is under close watch, as a break above this level could signal a bullish reversal.
The RSI, a momentum oscillator, provides further insights. When the RSI is below 30, it indicates oversold conditions, suggesting a potential upward correction. However, the presence of bearish divergence, where the price makes higher highs but the RSI makes lower highs, complicates the picture. This mixed signal underscores the need for a nuanced approach to technical analysis.
Moving Averages and Volume
Moving averages (MAs) are another crucial component of technical analysis. Bitcoin’s interaction with the Exponential Moving Average (EMA) 9 support level is a critical factor to consider. A failure to hold this support could lead to further downside, while a bounce off this level could indicate a bullish reversal.
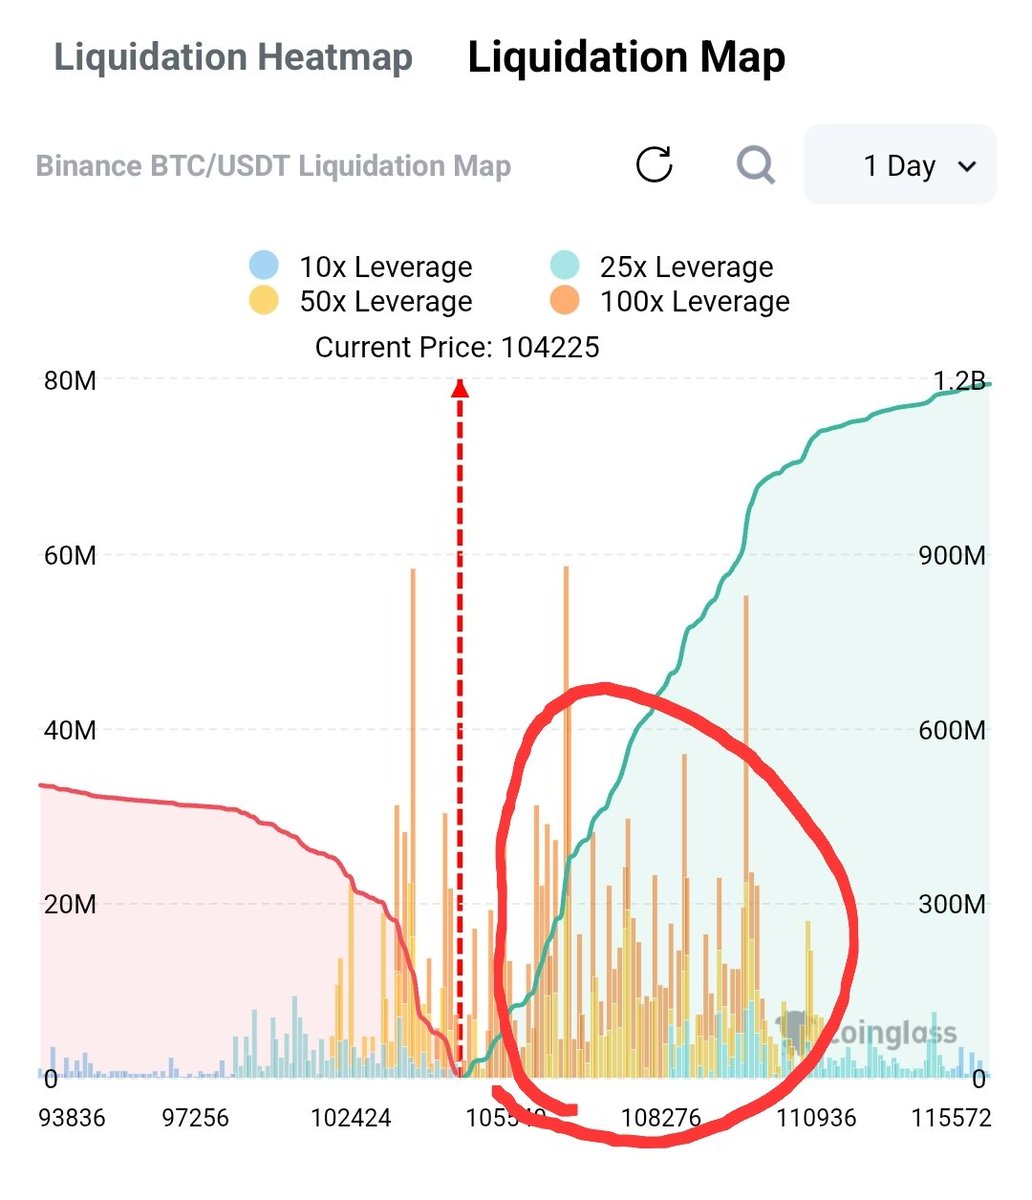
Volume analysis adds another layer of complexity. Increasing sell volume, as observed in recent weeks, suggests bearish sentiment. This, combined with bearish divergence, paints a cautious picture for Bitcoin’s near-term prospects. However, volume spikes can also signal the end of a downtrend, as selling pressure is exhausted.
The Broader Market Context
Federal Reserve’s Influence
The cryptocurrency market does not operate in isolation. External factors, such as the Federal Reserve’s monetary policy, significantly impact Bitcoin’s price movements. The upcoming Fed rate announcement is a critical event, with the potential to either bolster or undermine Bitcoin’s price. Analysts are closely monitoring the no-hype, data-driven signals to gauge the market’s reaction.
Altcoins and Market Sentiment
Altcoins, or alternative cryptocurrencies, often move in tandem with Bitcoin. However, there are instances where altcoins outperform or underperform Bitcoin, driven by their unique fundamentals and market sentiment. For example, the migration of $MATIC to $POL has been a topic of debate, with some analysts questioning the accuracy of Dune analytics.
Conclusion: Navigating the Uncertainty
Bitcoin’s current state is a testament to the intricate dance of emotions, technical indicators, and external factors that drive the cryptocurrency market. As we stand on the cusp of a potential breakout or breakdown, it is crucial to adopt a balanced and informed approach.
The use of AI in trading offers a promising solution to the emotional rollercoaster that characterizes the crypto market. By leveraging data-driven insights, traders can make more rational decisions, reducing the impact of greed and fear.
As we look ahead, the key takeaway is the need for vigilance and adaptability. The cryptocurrency market is in a constant state of flux, and those who can navigate its complexities with a clear mind and a strategic approach are more likely to succeed. Whether Bitcoin bounces back or continues its downward trajectory, one thing is certain: the journey is far from over.