The Pitfalls of Surface-Level Analysis
Correlation vs. Comprehension
In the realm of Bitcoin analysis, many analysts rely on correlations to draw conclusions. For example, they might observe that Bitcoin prices tend to rise when the money supply increases and conclude that this is a causal relationship. While such correlations can be useful, they often fall short of providing a deeper understanding of the underlying mechanisms driving Bitcoin’s value. Correlation does not imply causation, and without a comprehensive analysis, these observations can lead to oversimplified conclusions and missed opportunities for more insightful analysis[1].
Consider the common observation that Bitcoin prices rise during periods of economic uncertainty. While this correlation is evident, it does not explain why this happens or what other factors might be at play. For instance, the increased demand for Bitcoin as a store of value during economic turmoil is just one piece of the puzzle. Other factors, such as regulatory changes, technological advancements, and market sentiment, also play significant roles. By focusing solely on correlations, analysts risk overlooking these critical elements, leading to an incomplete understanding of Bitcoin’s market behavior.
The Limitations of Chart-Based Analysis
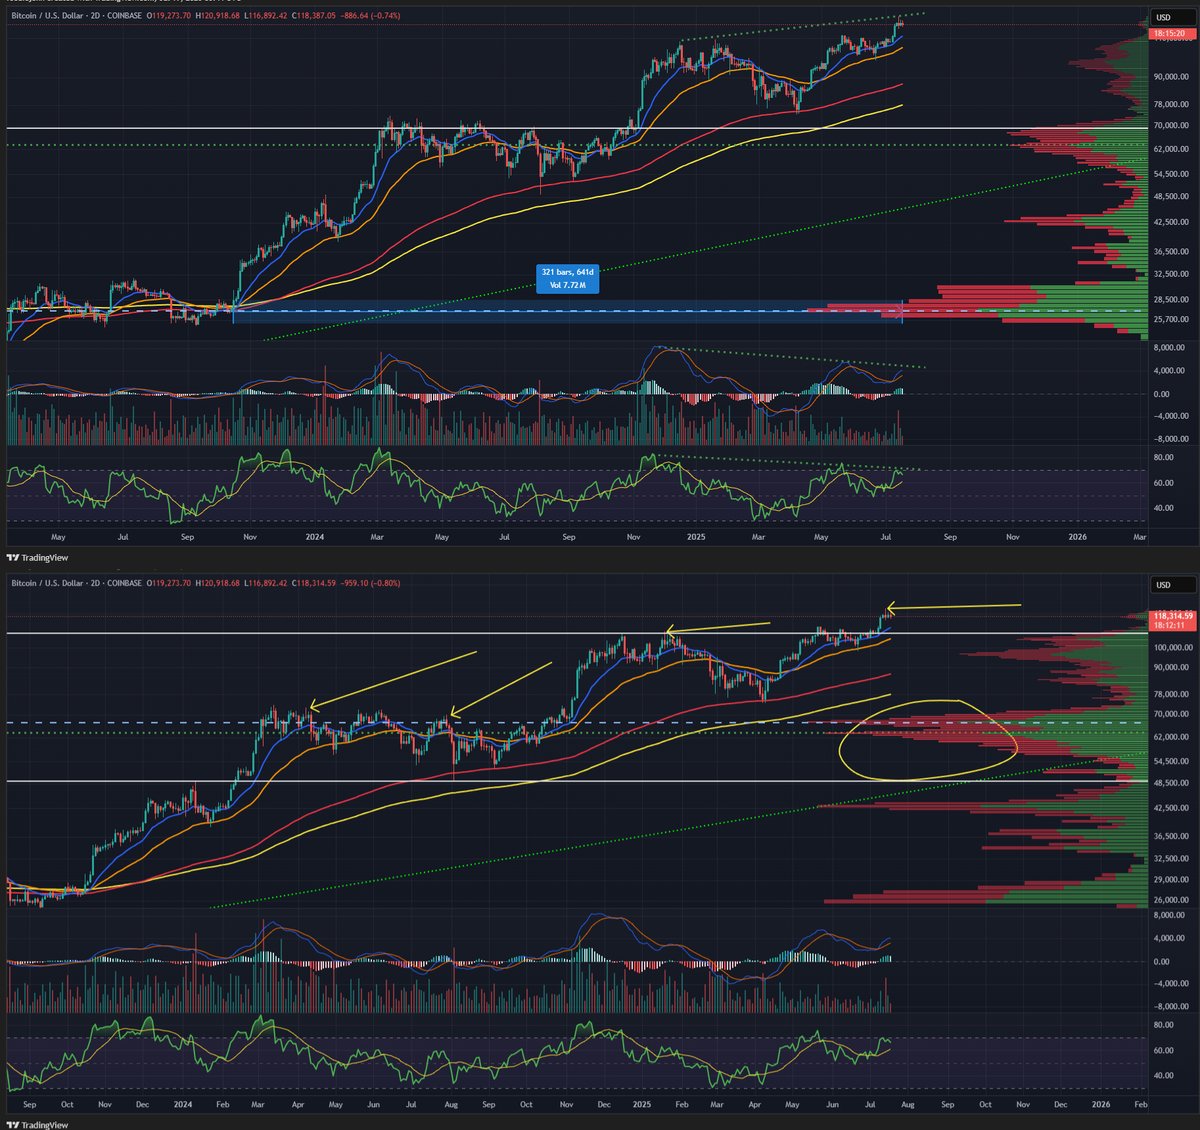
Chart-based analysis is a popular tool in Bitcoin analysis, offering visual representations of market trends and patterns. However, charts alone do not capture the full context of market behavior. For example, a falling wedge pattern might indicate a potential breakout, but without considering external factors like regulatory changes or technological advancements, the analysis remains incomplete. Charts can show trends and patterns, but they do not always provide the deeper insights needed to make informed decisions[2].
Take the example of a falling wedge pattern observed in Bitcoin’s price chart. While this pattern might suggest a potential breakout, the actual outcome depends on various factors beyond the chart itself. For instance, a sudden regulatory crackdown on cryptocurrencies could significantly impact Bitcoin’s price, regardless of the chart pattern. Similarly, technological advancements, such as the implementation of Layer 2 solutions, can influence market behavior in ways that are not immediately apparent from a chart. Therefore, relying solely on chart-based analysis can be misleading and may lead to incorrect conclusions.
Delving Deeper: Comprehensive Bitcoin Analysis
Understanding Layer 2 Solutions
Bitcoin’s Layer 2 solutions are not just about scaling; they are redefining the decentralized finance (DeFi) landscape. These solutions address some of the scalability and usability issues that have plagued the Bitcoin network, making it more efficient and secure. For example, cross-chain lending is gaining traction, allowing for more efficient and secure transactions. By understanding these technological developments, analysts can better predict market movements and identify investment opportunities[3].
Layer 2 solutions, such as the Lightning Network, enable faster and cheaper transactions by processing them off the main Bitcoin blockchain. This not only improves the scalability of the network but also enhances its usability for everyday transactions. Moreover, these solutions open up new possibilities for DeFi applications, such as cross-chain lending and decentralized exchanges. By keeping an eye on these technological advancements, analysts can gain a deeper understanding of Bitcoin’s potential and make more informed investment decisions.
Market Dynamics and Technical Indicators
Technical indicators play a significant role in Bitcoin analysis. Indicators like the STH MVRV Bollinger Bands can provide valuable insights into market sentiment and potential price movements. For example, when the STH MVRV Bollinger Bands approach the middle threshold line, it can signal a potential shift in market dynamics. Keeping an eye on such indicators can help traders make more informed decisions and avoid being caught off guard by sudden market changes[4].
The STH MVRV (Short-Term Holder Market-Value-to-Realized-Value) Bollinger Bands are a powerful tool for analyzing market sentiment. By tracking the market value of Bitcoin relative to its realized value, this indicator can help identify overbought or oversold conditions. For instance, when the STH MVRV Bollinger Bands approach the middle threshold line, it may indicate that the market is nearing a point of equilibrium, and a shift in market dynamics could be imminent. By incorporating such technical indicators into their analysis, traders can gain a more comprehensive view of the market and make more informed trading decisions.
The Role of Market Cap and Volume
Market capitalization and trading volume are essential metrics for understanding Bitcoin’s market behavior. A breakout from a falling wedge pattern with significant volume, as seen in the altcoin market, can indicate a strong bullish rally. Similarly, a successful retest of the breakout level can confirm the trend and provide a clearer picture of the market’s direction. These metrics, when analyzed in conjunction with other indicators, can offer a more comprehensive view of the market[5].
Market capitalization represents the total value of all Bitcoin in circulation, providing a snapshot of the market’s size and potential. Trading volume, on the other hand, indicates the level of market activity and can help confirm trends and patterns observed in the price chart. For example, a breakout from a falling wedge pattern with significant volume suggests strong market participation and can indicate a potential bullish rally. Similarly, a successful retest of the breakout level with high volume can confirm the trend and provide a clearer picture of the market’s direction. By analyzing these metrics in conjunction with other indicators, analysts can gain a more comprehensive understanding of Bitcoin’s market behavior.
The Future of Bitcoin: Opportunities and Challenges
The $300 Trillion Market Ambition
Bitcoin’s ambitious goal of capturing a $300 trillion addressable market requires careful examination. While Bitcoin has shown impressive year-over-year growth, achieving such a market cap would involve significant challenges and opportunities. Understanding the factors that could drive or hinder this growth is crucial for long-term investors and analysts. This includes considering regulatory environments, technological advancements, and market sentiment[6].
To capture a $300 trillion market, Bitcoin would need to overcome several challenges, including regulatory hurdles, technological limitations, and market competition. Regulatory environments play a crucial role in shaping the future of Bitcoin, as strict regulations can hinder its adoption and growth. Technological advancements, such as Layer 2 solutions, are essential for improving the scalability and usability of the network. Market sentiment, driven by factors like media coverage and public perception, can also significantly impact Bitcoin’s market behavior. By carefully examining these factors, analysts can better understand the opportunities and challenges that lie ahead for Bitcoin.
The Importance of Continuous Learning
The cryptocurrency market is dynamic and ever-changing. Continuous learning and adaptation are essential for staying ahead of the curve. Subscribing to newsletters like “Your Daily Bitcoin Breakdown” can provide valuable insights and keep analysts informed about the latest developments in the Bitcoin ecosystem. This ongoing education is key to making informed decisions and avoiding pitfalls in the volatile cryptocurrency market[7].
In the fast-paced world of cryptocurrency, staying informed is crucial for making informed decisions. Newsletters, blogs, and social media platforms can provide valuable insights and keep analysts up-to-date on the latest developments in the Bitcoin ecosystem. For example, “Your Daily Bitcoin Breakdown” offers daily updates on market trends, technological advancements, and regulatory changes, helping analysts stay ahead of the curve. By continuously learning and adapting to new information, analysts can make more informed decisions and avoid being caught off guard by sudden market changes.
Conclusion: Beyond the Charts
Embracing a Holistic Approach
To truly understand Bitcoin and its market behavior, it is essential to move beyond surface-level analysis. Embracing a holistic approach that considers technological advancements, market dynamics, and external factors can provide a more comprehensive and accurate picture. This approach not only helps in making better investment decisions but also contributes to the broader understanding and adoption of Bitcoin.
By delving deeper into the intricacies of Bitcoin analysis, analysts can uncover valuable insights that go beyond mere correlations. This deeper understanding is crucial for navigating the complex and ever-changing world of cryptocurrency. By incorporating a holistic approach that considers technological advancements, market dynamics, and external factors, analysts can gain a more comprehensive view of Bitcoin’s market behavior and make more informed investment decisions.