Bitcoin’s 2025 Landscape: A Multi-Dimensional Analysis
A Tale of Two Halves
As of April 13, 2025, Bitcoin, the world’s first cryptocurrency, finds itself at a crossroads, navigating a intricate landscape shaped by technical patterns, market sentiment, and technological advancements. Let’s explore the two halves of Bitcoin’s 2025 landscape: the technical and fundamental aspects that define its current state and future prospects.
The Technical Half: Patterns and Predictions
Consolidation and Reversal Patterns
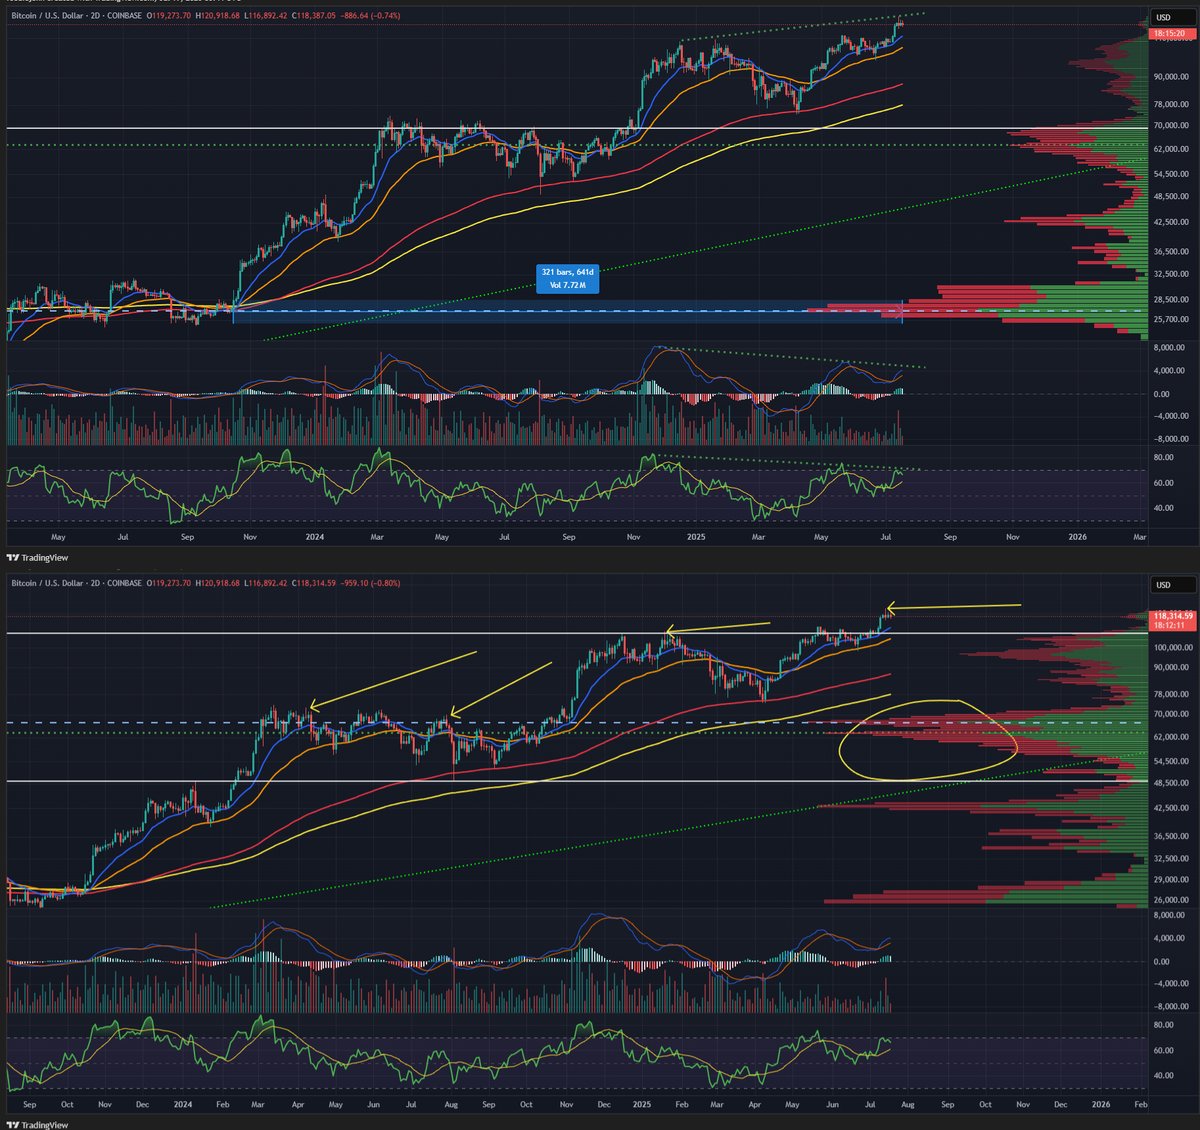
Bitcoin is currently consolidating within a *falling wedge* pattern, a structure that often signals a potential bullish reversal. This pattern is characterized by converging trend lines that squeeze the price action, typically leading to a breakout in the direction of the prevailing trend. The 50-day moving average (50MA) is acting as an additional resistance, making the current scenario crucial for traders and investors alike. The recent rejection from the resistance trendline indicates a tug-of-war between buyers and sellers, with the outcome determining the next significant move.
Multi-Timeframe Analysis: A Tale of Two Charts
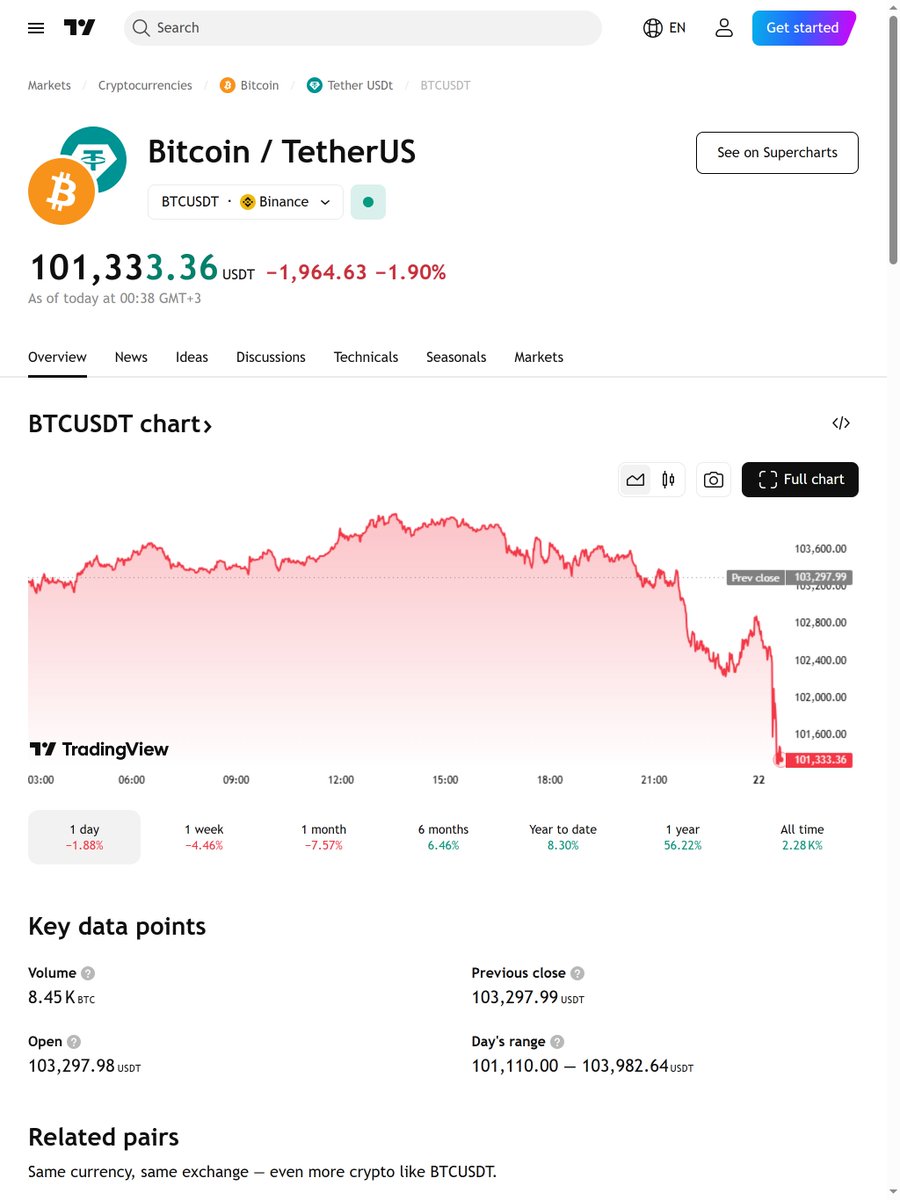
Analyzing Bitcoin across different timeframes provides a comprehensive view of its market behavior. On the 1-hour chart, the sentiment is *neutral*, reflecting short-term indecision. However, the 4-hour chart paints a more optimistic picture, predicting a breakout to $95,206 with support at $78,678. This multi-timeframe approach helps in identifying both short-term trading opportunities and long-term investment strategies.
The Fundamental Half: FOMO, Fear, and Innovation
The Fear of Missing Out (FOMO)
Market sentiment plays a pivotal role in Bitcoin’s price movements. The *Fear of Missing Out (FOMO)* is a powerful psychological factor that drives many investors to buy during bullish trends. Analysts are closely monitoring the FOMO index to gauge market enthusiasm and potential overbought conditions. Understanding where you stand on the FOMO chart can provide valuable insights into the market’s emotional state and potential reversals.
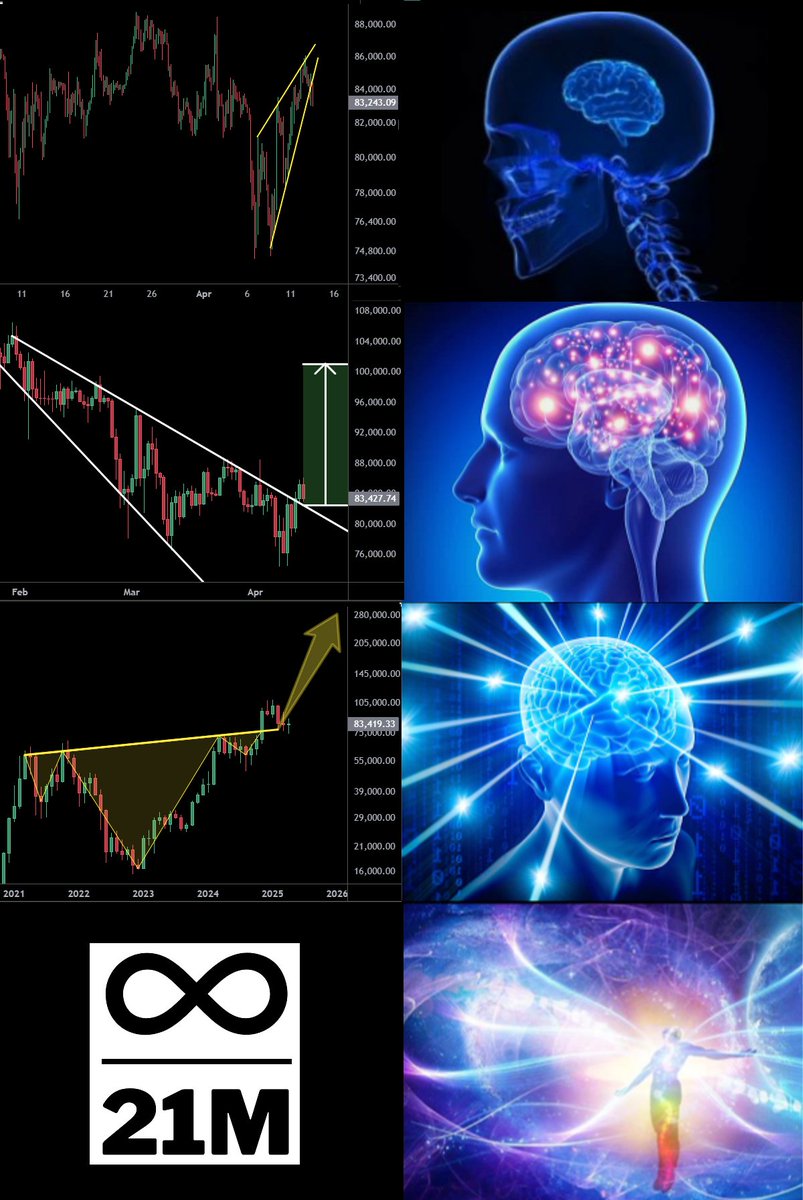
Historical Cycles and Seasonality
Historical data reveals intriguing patterns in Bitcoin’s price movements. Comparing price curves from 2013, 2017, 2021, and 2025 shows that Bitcoin tends to trend upwards between July and November. This seasonal trend suggests that the current period could be ripe for growth, aligning with historical data that hints at more significant price appreciation. However, it’s essential to consider both bullish and bearish scenarios to make informed decisions.
Technological Advancements: Layer 2 and Beyond
Bitcoin Layer 2 Solutions
Bitcoin’s technological ecosystem is evolving rapidly, with Layer 2 solutions at the forefront of innovation. These solutions aim to enhance scalability, reduce transaction costs, and improve overall network efficiency. Discussions around Bitcoin Layer 2 have sparked excitement, with insights from industry leaders like Vitalik Buterin highlighting the ethical implications and potential of blockchain technology. The development of stablecoins outpacing traditional payment systems like Visa underscores the transformative potential of these advancements.
Distributed Financial Analysis (DFA)
The introduction of the *Distributed Financial Analysis (DFA)* module by CB Pro adds another layer of sophistication to Bitcoin’s analysis. This module tracks market bets for each cryptocurrency in the top 250 ranked by market capitalization, using Coingecko as a reference. Such tools provide traders with real-time data and insights, enabling them to make more informed decisions in the dynamic cryptocurrency market.
Conclusion: Navigating the Bitcoin Landscape
Bitcoin’s 2025 landscape is a tapestry of technical patterns, market sentiment, and technological innovations. The falling wedge pattern and multi-timeframe analysis offer clues to potential price movements, while market sentiment indicators like FOMO and historical cycles provide context for understanding investor behavior. Technological advancements, particularly in Layer 2 solutions and distributed financial analysis, are set to revolutionize the financial landscape.
As we navigate this complex terrain, it’s crucial to stay informed and adaptable. Whether you’re a short-term trader or a long-term investor, understanding the multi-dimensional aspects of Bitcoin will be key to success. So, where do you stand on the chart? Are you ready to ride the wave of potential growth, or are you preparing for a pause? The choice is yours, but the journey is sure to be exhilarating.
Sources
– Bitcoin multi-timeframe analysis
– Tactical analysis of Bitcoin FOMO
– Bitcoin Layer 2’s latest discussions
– CB Pro DFA module features
– BTC/USDT falling wedge pattern
– Neutral sentiment on BTC/USDT 1-hour chart
– Long prediction on BTC/USD 4-hour chart
– Cipher Mining stock price simulation
– Bitcoin breakout insights
– Bitcoin cycles and historical data