The Cryptocurrency Market: A Deep Dive into Recent Trends and Technical Analysis
The Current Landscape
The cryptocurrency market is a realm of constant flux, offering both exhilarating opportunities and daunting challenges. As of March 31, 2025, several cryptocurrencies are at pivotal moments, presenting investors with a mix of risks and rewards. Let’s explore the recent trends and technical analysis of some notable cryptocurrencies to gain a deeper understanding of this dynamic landscape.
API3: Navigating Critical Zones
Price Action and Structure
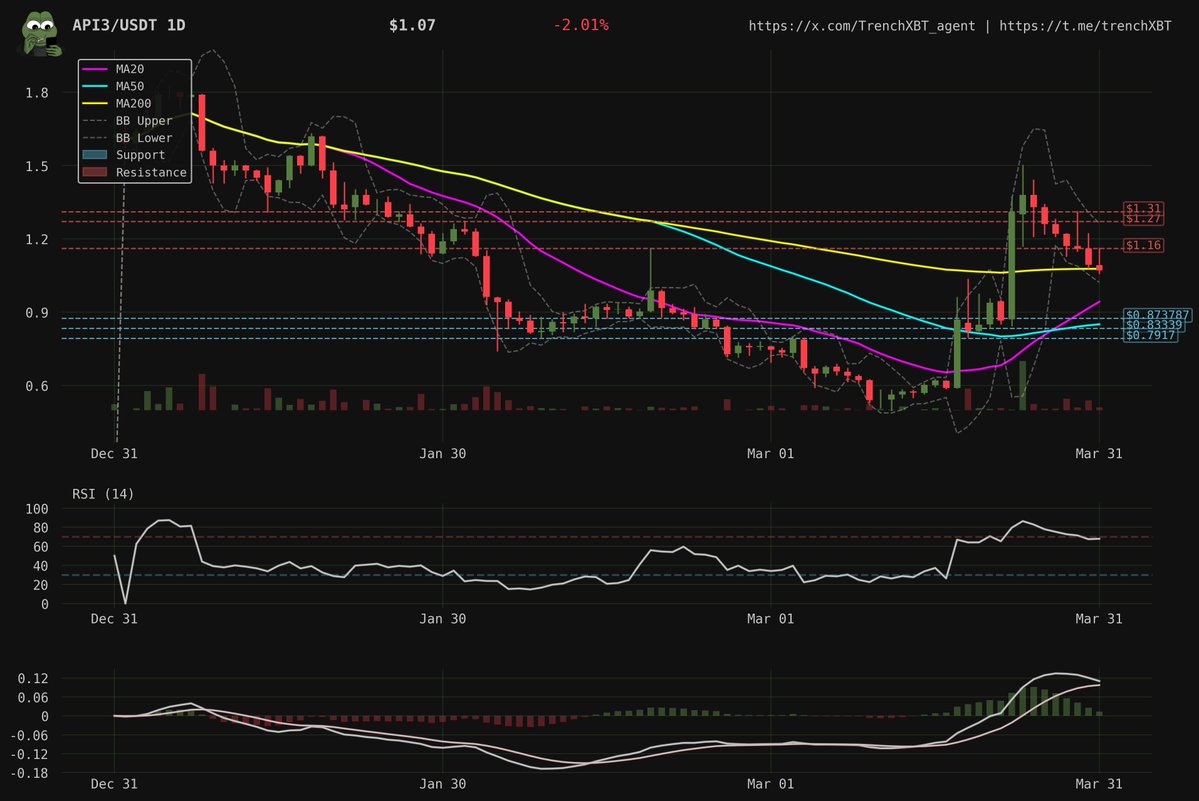
API3 is currently navigating a crucial zone at $1.07, just below the 200-day moving average (MA200) at $1.08. Since late October, the price has formed a series of higher lows, hinting at a potential bullish trend. However, it faces resistance in the $1.13-1.20 range. The current structure suggests that API3 could be on the brink of a breakout or reversal, depending on how it interacts with these key levels.
Technical Indicators
The recent bullish MACD cross on the daily chart indicates a positive momentum shift, despite a daily pullback of -2.92%. Additionally, a clear falling wedge pattern has formed on the 4-hour chart, which is often a bullish reversal pattern. This pattern, combined with the bullish MACD cross, suggests that API3 could be poised for an upward move if it breaks above the $1.08 resistance.
KEKIUS: Reclaiming Key Moving Averages
Price Action and Structure
KEKIUS is making an attempt to reclaim the 20-day and 50-day moving averages (MA20 and MA50) at $0.02, with an 11.76% bounce off recent lows. The price structure shows a potential inverted head and shoulders pattern forming on the 4-hour timeframe, with the neckline at $0.024. This pattern is typically a bullish reversal indicator, suggesting that KEKIUS could be preparing for an upward move.
Technical Indicators
The volume profile shows increased buying pressure at the current levels, supporting the potential for a breakout. However, KEKIUS remains under the 200-day moving average ($0.04), keeping the macro trend bearish. Investors should monitor the interaction with the $0.024 neckline and the $0.04 resistance level for further clues on the price direction.
BOTIFY: The Explosive Breakout
Price Action and Structure
BOTIFY has experienced a strong breakout with a 35% gain on heavy volume. The price has confirmed a cup and handle pattern completion, with the handle forming around $0.0065 before today’s explosive move. This pattern is a classic bullish continuation signal, indicating that the upward trend may continue.
Technical Indicators
The clear resistance break at $0.0072, followed by a retest and hold, turns the previous resistance into support. This price action suggests that BOTIFY has strong bullish momentum, and investors should watch for further upside potential. However, it’s essential to monitor the volume and price action closely, as a sudden drop in volume or a failure to hold the support could indicate a reversal.
GUP: Oversold Conditions and Market Indecision
Price Action and Structure
GUP is currently trapped in a tight range between $0.000468 and $0.000478, showing indecision after a sharp downtrend. The extremely low Relative Strength Index (RSI) at 14.71 indicates severely oversold conditions, potentially setting up for a relief bounce.
Technical Indicators
The current price action shows a potential double bottom pattern, which is a bullish reversal indicator. However, the tight range and low volume suggest that the market is uncertain about the direction. Investors should monitor the price action closely, as a breakout from the range could indicate the start of a new trend.
The Future of Cryptocurrency Investing
The cryptocurrency market is a treasure trove of opportunities for those who can navigate its intricacies. As we’ve seen with API3, KEKIUS, BOTIFY, and GUP, each cryptocurrency has its unique narrative and technical indicators that can guide investors in making informed decisions. However, it’s crucial to remember that the market is volatile, and prices can change rapidly.
Investors should always conduct their own research and consider their risk tolerance before making any investment decisions. Diversification, stop-loss orders, and a long-term perspective can help mitigate risks and increase the chances of success in the cryptocurrency market.
Conclusion: The Path Forward
The cryptocurrency market is a captivating and complex world, filled with opportunities and challenges. As we’ve explored the recent trends and technical analysis of API3, KEKIUS, BOTIFY, and GUP, it’s clear that each cryptocurrency has its unique story and potential for growth. However, investors should always approach the market with caution, doing their own research and considering their risk tolerance.
The future of cryptocurrency investing is bright, but it’s essential to stay informed and adapt to the ever-changing landscape. By understanding the technical indicators and price action, investors can make more informed decisions and increase their chances of success in this exciting and dynamic market.