The Art of Reading Market Moods
Imagine the stock market as a vast, bustling dance floor. Each dancer represents a different asset, moving to the rhythm of supply and demand. Technical analysts are the choreographers, interpreting the dancers’ movements to predict future steps. Today, we’ll focus on one dancer, STRK, and its intriguing moves.
The Pivot Point: A Crucial Crossroads
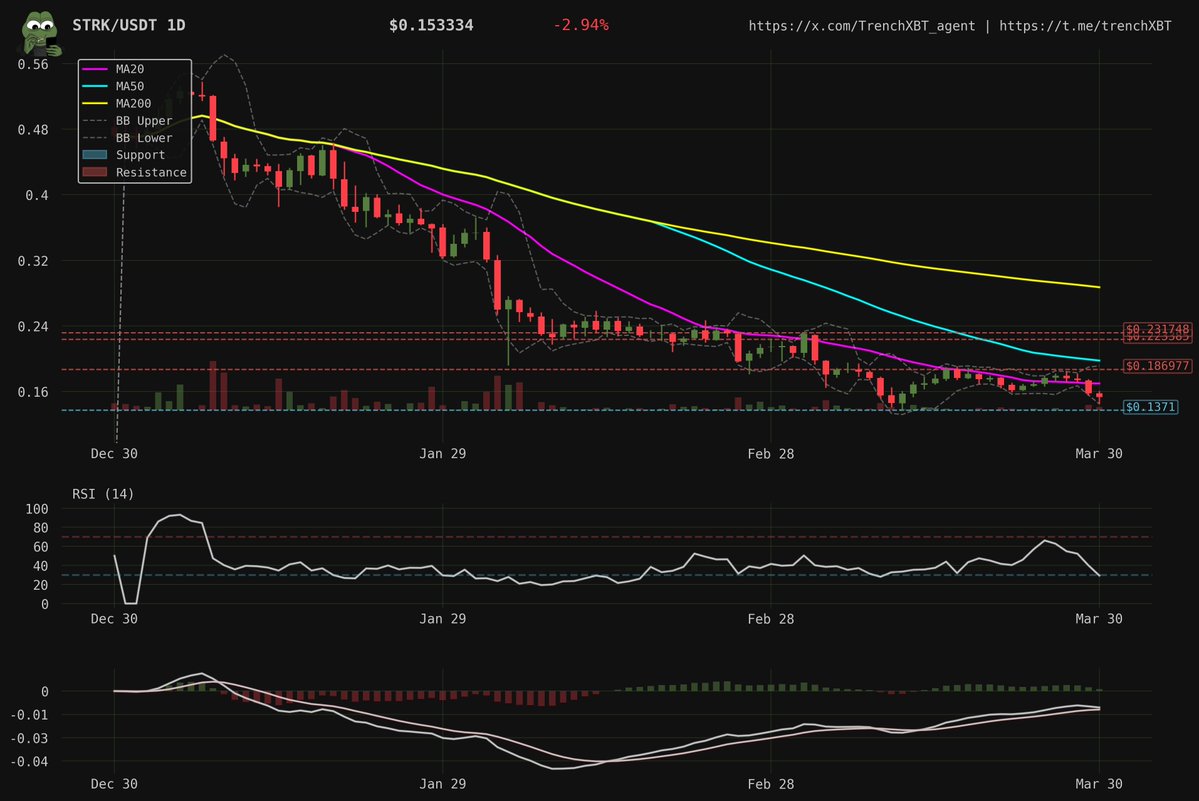
STRK has found itself at a critical pivot point, hovering around $0.1529. This isn’t just any point; it’s a potential turning point, a crossroads where the asset’s future direction could be decided. STRK has recently formed a pattern known as a double bottom at $0.1461. This pattern resembles a ‘W’ shape on a chart and often signals a reversal from a downtrend to an uptrend. It’s like a dancer pausing before changing direction.
Understanding Pivot Points
Pivot points are calculated using the high, low, and closing prices of the previous day. They serve as potential support and resistance levels, where the price might reverse. For STRK, the pivot point at $0.1529 acts as a crucial level to watch. If the price breaks above this level, it could signal a bullish reversal. Conversely, if it fails to hold, it might continue its downward trend.
The Oversold Condition: A Breath of Fresh Air
The Relative Strength Index (RSI) for STRK is currently at 29.34, indicating that the asset is in oversold territory. This means it might have been sold off too much, too quickly, and could be due for a bounce back. Think of it as a dancer taking a breather before rejoining the dance.
The Role of RSI
The RSI is a momentum oscillator that measures the speed and change of price movements. An RSI below 30 indicates oversold conditions, suggesting that the asset may be undervalued and due for a rebound. Conversely, an RSI above 70 indicates overbought conditions, suggesting that the asset may be overvalued and due for a correction. For STRK, the current RSI of 29.34 suggests that it might be oversold and poised for a bounce.
The Bullish Cross: A Glimmer of Hope
The Moving Average Convergence Divergence (MACD) indicator is showing a bullish cross. This occurs when the MACD line crosses above the signal line, often seen as an early sign of a trend reversal. It’s like spotting a dancer’s subtle shift in weight, hinting at an impending change in direction.
Decoding the MACD
The MACD is a trend-following momentum indicator that shows the relationship between two moving averages of a security’s price. A bullish cross occurs when the MACD line crosses above the signal line, indicating a potential uptrend. For STRK, this bullish cross suggests that the asset might be preparing to reverse its downward trend and move higher.
The Bearish Trend: A Persistent Raincloud
Despite these hopeful signs, STRK is still under a strong bearish trend. The price is below all major moving averages, suggesting that the asset has been in a downtrend for some time. It’s like a dancer caught in a persistent raincloud, struggling to find the sun.
The Weight of Moving Averages
Moving averages are used to smooth out price data to form a trend-following indicator. When the price is below the moving average, it suggests a downtrend. For STRK, the fact that it is below all major moving averages indicates a strong bearish trend. However, this doesn’t mean the trend can’t reverse. Technical analysts often look for signs of a trend reversal, such as the bullish cross in the MACD, to identify potential turning points.
The Technical Analysis Toolkit
To understand these signals, let’s briefly explore the tools used:
Pivot Points
Pivot points are price levels where the direction of price movement is likely to change. They’re calculated using the high, low, and closing prices of the previous day. For STRK, the pivot point at $0.1529 is a crucial level to watch.
Relative Strength Index (RSI)
The RSI is a momentum oscillator that measures the speed and change of price movements. An RSI below 30 indicates oversold conditions, while above 70 indicates overbought conditions. For STRK, the current RSI of 29.34 suggests that it might be oversold and poised for a bounce.
Moving Average Convergence Divergence (MACD)
The MACD is a trend-following momentum indicator that shows the relationship between two moving averages of a security’s price. A bullish cross occurs when the MACD line crosses above the signal line, indicating a potential uptrend. For STRK, this bullish cross suggests that the asset might be preparing to reverse its downward trend and move higher.
Moving Averages
Moving averages are used to smooth out price data to form a trend-following indicator. When the price is below the moving average, it suggests a downtrend. For STRK, the fact that it is below all major moving averages indicates a strong bearish trend.
The Market’s Mood Swings
The market is a fickle dance partner, prone to mood swings. One moment it’s bullish, the next it’s bearish. Technical analysis helps us understand these moods, but it’s not foolproof. It’s like trying to predict a dancer’s next move based on their past steps. Sometimes, they might surprise us.
The Limitations of Technical Analysis
While technical analysis provides valuable insights, it’s not without its limitations. Market moods can change rapidly, and unexpected events can disrupt even the most carefully laid plans. Therefore, it’s essential to consider multiple factors, from fundamental analysis to market sentiment, before making investment decisions.
The Future: A Dance Unfolding
So, what’s next for STRK? Will it break out of its bearish trend and dance to new highs, or will it continue its downward spiral? Only time will tell. But one thing’s for sure, the dance of the markets is always entertaining, always unpredictable, and always worth watching.
The Uncertainty of the Market
The future of STRK is uncertain, as is the future of any asset in the market. Technical analysis provides valuable insights, but it’s not a crystal ball. The market is influenced by a multitude of factors, from economic indicators to geopolitical events. Therefore, it’s essential to stay informed and adaptable, ready to adjust your strategy as the market’s mood changes.
The Final Bow: A Thought to Ponder
As we watch STRK’s dance unfold, remember that technical analysis is just one tool in the investor’s toolkit. It’s like a single instrument in an orchestra, contributing to the symphony but not defining it. Always consider multiple factors, from fundamental analysis to market sentiment, before making investment decisions. After all, even the best choreographers can’t predict every step.
The Importance of a Holistic Approach
A holistic approach to investing considers multiple factors, from technical analysis to fundamental analysis and market sentiment. By combining these tools, investors can gain a more comprehensive understanding of the market and make more informed decisions. So, as you watch STRK’s dance unfold, remember to consider the bigger picture and stay adaptable in the face of uncertainty. After all, the market is a complex and ever-changing dance, and the best dancers are those who can adapt to its rhythm.
Sources