
Mastering Crypto Markets: The Power of Technical Analysis
Introduction
In the fast-paced world of cryptocurrencies, one skill stands out as a game-changer: technical analysis. It’s not just about drawing lines on charts; it’s about understanding market behavior, predicting trends, and making informed trading decisions. Let’s explore the power of technical analysis, inspired by insights from crypto influencers @kingtee_rex and @pixelden_crypto.
Understanding Technical Analysis
What is Technical Analysis?
Technical analysis is a method of evaluating securities by studying market data, such as historical price and volume. It’s based on the idea that price action repeats patterns, and these patterns can help predict future price movements [1].
Why Use Technical Analysis in Crypto?
Cryptocurrencies, with their volatile nature and around-the-clock markets, are ideal for technical analysis. It helps traders:
Charts: The Canvas of Technical Analysis
Types of Charts
Candlestick, bar, and line charts are commonly used in crypto. Each has its strengths, but candlesticks are popular due to their ability to show price action, volume, and sentiment [2].
Key Chart Components
– Support and Resistance Levels: Prices often struggle to break through these levels, creating opportunities for traders.
– Trendlines: Connecting two or more highs (resistance) or lows (support) to identify trends.
– Indicators: Mathematical calculations based on price and/or volume data, like Moving Averages (MAs) and Relative Strength Index (RSI).
Analyzing the Tweets
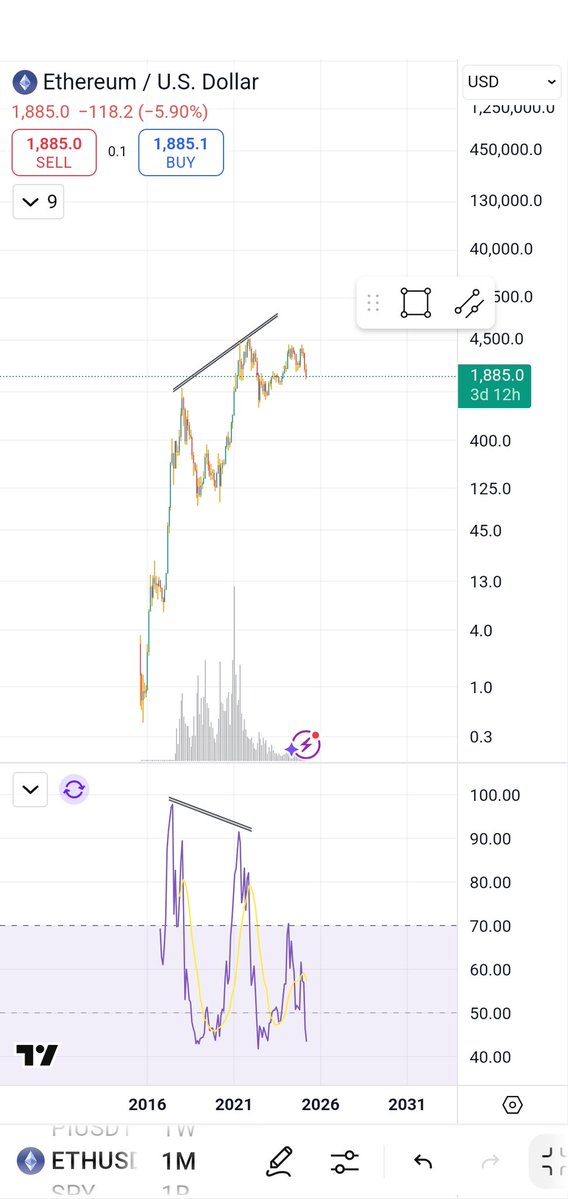
> “Your problem was you didn’t properly analyze your charts. Call me crazy but the moment I noticed this divergence on Ethereum, I knew the coin was going to experience a massive correction. I don’t trade corrections.”
Here, @kingtee_rex emphasizes the importance of chart analysis. A divergence occurs when the price makes a new high or low, but the indicator (like RSI) doesn’t confirm it. This suggests a potential trend reversal [3].
> “Master the charts, master the market! … Knowledge is power in trading—analyze, strategize, and execute with confidence.”
@pixelden_crypto stresses the power of chart mastery. Confident trading comes from understanding market behavior and having a solid strategy.
Practical Tips for Crypto Traders
1. Keep it Simple
Start with basic indicators like MAs and RSI. Don’t overcomplicate your analysis.
2. Use Multiple Timeframes
Analyze charts on different timeframes (e.g., daily, 4-hour, 1-hour) to gain a broader perspective.
3. Combine Technicals with Fundamentals
News and project developments can drive price action. Consider both when making decisions.
4. Backtest and Practice
Use historical data to test your strategies. Paper trading can help you gain experience without risking real capital.
Conclusion: The Power of Mastery
Mastering technical analysis is like learning a new language. It takes time, practice, and patience. But once you’re fluent, you’ll gain a powerful tool for navigating the crypto markets. So, grab your charts, and start analyzing. The market awaits!
Sources
[1] Investopedia: Technical Analysis
[2] Coinbase: Crypto Chart Basics
Further Reading
– CoinMarketCap: Technical Analysis for Cryptocurrency
– CoinDesk: Technical Analysis: A Beginner’s Guide
– Binance Academy: Technical Analysis