The Current Landscape
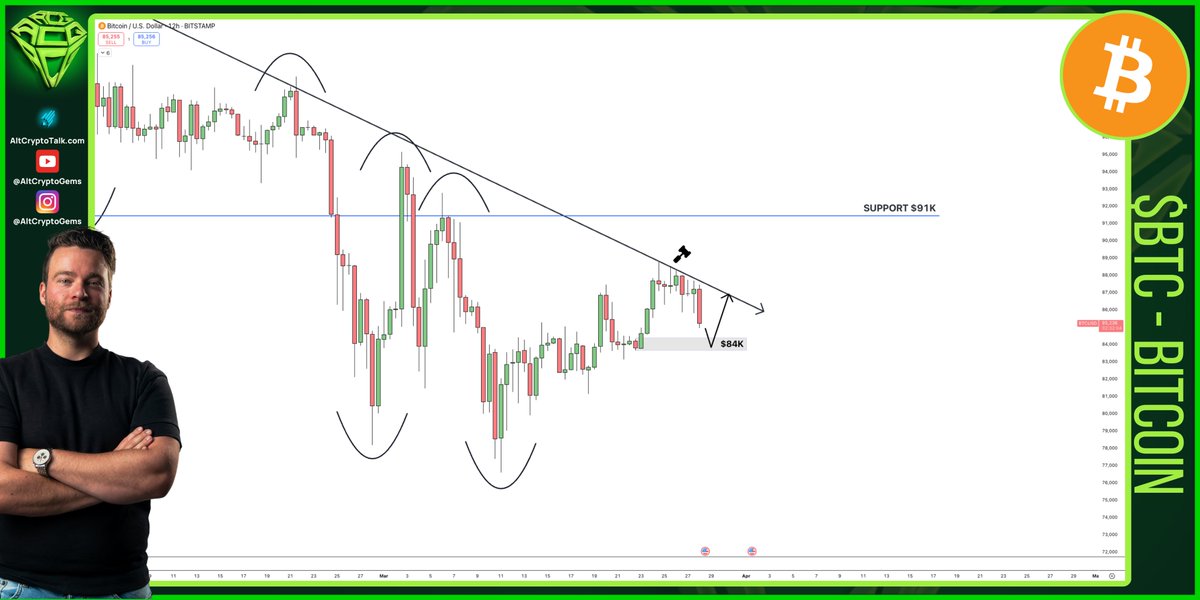
Imagine standing at the edge of a cliff, looking down at the tumultuous waves of the crypto market. Today, Bitcoin finds itself at a similar precipice. The world’s leading cryptocurrency has once again been rejected at a critical resistance level, confirming a local downtrend. As of March 28, 2025, the bulls are needed to defend the $84,000 mark to preserve the 4-hour bullish market structure. But what does this mean for investors, and what can we expect in the coming weeks?
Understanding the Technicals
The Diagonal Resistance
To grasp the current situation, let’s dive into the technicals. Bitcoin has been facing a diagonal resistance line, a trendline that connects a series of lower highs. This line has proven to be a formidable barrier, with the price bouncing back down each time it approaches. This pattern is a classic example of a descending trend channel, indicating a bearish sentiment in the short term.
The diagonal resistance line is not just a random occurrence but a critical indicator of market sentiment. It represents the collective psychology of traders who have repeatedly failed to push the price above this level. This resistance line acts as a psychological barrier, making it harder for bullish trends to sustain momentum. Understanding this resistance is crucial for predicting future price movements and making informed trading decisions.
The $84,000 Support Level
The $84,000 mark is a crucial support level for Bitcoin. If the price falls below this point, it could signal a further decline, potentially leading to a more significant downtrend. The bulls, therefore, need to step in and defend this level to maintain the current 4-hour bullish market structure. But what if they fail?
Support levels are pivotal points where buying pressure is expected to increase, preventing the price from falling further. The $84,000 support level has historical significance, having been tested multiple times in the past. If this level is breached, it could trigger a cascade of sell orders, leading to a rapid decline in price. However, if the bulls can hold this line, it could signal a reversal and the beginning of a new uptrend.
The Bearish Scenario
If the bears manage to break down the $84,000 support, we could see a steep decline. The next significant support level is around $70,000, but if the selling pressure continues, the price could drop even further. This scenario would be a nightmare for bullish investors, but it’s essential to consider all possibilities.
A bearish scenario involves several stages. Initially, the price may experience a sharp decline as traders rush to sell their holdings. This selling pressure can create a self-reinforcing loop, with each sell order triggering more sell orders. If the price falls below $70,000, it could enter a freefall, with no immediate support levels to halt the decline. This scenario is not just about technical analysis but also about market psychology, where fear and uncertainty drive the price downwards.
The Bullish Counterattack
However, the story doesn’t end there. The market is a battlefield of bulls and bears, and the bulls are not going down without a fight. If they can successfully defend the $84,000 level, we could see a reversal. The price might break through the diagonal resistance, leading to a bullish trend. But for this to happen, the bulls need to show up in force.
A bullish counterattack requires a concerted effort from buyers to push the price above the resistance level. This often involves significant buying volume, which can create a positive feedback loop, attracting more buyers and driving the price higher. If the bulls can sustain this momentum, it could lead to a new uptrend, with the price potentially reaching new all-time highs. However, this scenario is contingent on the bulls’ ability to maintain buying pressure and overcome the psychological barrier of the resistance line.
The Broader Picture
While the short-term outlook is uncertain, it’s crucial to consider the broader picture. Bitcoin has a history of volatility, with sharp declines often followed by impressive recoveries. Moreover, the cryptocurrency market is influenced by a multitude of factors, including geopolitical events, regulatory changes, and technological advancements. Therefore, while the technicals provide valuable insights, they are not the be-all and end-all.
The broader picture involves looking at macroeconomic trends, regulatory environments, and technological innovations. For instance, positive regulatory developments, such as the approval of Bitcoin ETFs, can boost investor confidence and drive the price higher. Conversely, negative news, such as government crackdowns on cryptocurrencies, can trigger sell-offs and lead to price declines. Additionally, technological advancements, such as the development of the Lightning Network, can enhance Bitcoin’s utility and attract more users, potentially driving up the price.
The Role of Market Sentiment
Market sentiment plays a significant role in Bitcoin’s price movements. Fear, greed, and uncertainty can drive the price up or down, often in ways that defy logical explanation. Therefore, it’s essential to keep an eye on market sentiment indicators, such as the Fear & Greed Index, to gauge the overall mood of the market.
Market sentiment is a reflection of the collective emotions of traders and investors. When sentiment is high, traders are more likely to buy, driving the price higher. Conversely, when sentiment is low, traders are more likely to sell, leading to price declines. Understanding market sentiment can provide valuable insights into potential price movements and help traders make more informed decisions. For example, if the Fear & Greed Index is in the “extreme fear” zone, it could signal a buying opportunity, as the market may be oversold.
The Impact of External Factors
External factors, such as regulatory changes and geopolitical events, can also significantly impact Bitcoin’s price. For instance, positive regulatory developments can boost investor confidence, leading to a price rally. Conversely, negative news can trigger a sell-off, causing the price to plummet. Therefore, it’s crucial to stay informed about the latest developments in the crypto world and beyond.
External factors can have a profound impact on Bitcoin’s price. For example, regulatory changes, such as the approval of Bitcoin ETFs, can attract institutional investors and drive the price higher. Conversely, negative news, such as government crackdowns on cryptocurrencies, can trigger sell-offs and lead to price declines. Additionally, geopolitical events, such as trade wars or political instability, can create uncertainty and drive investors towards safe-haven assets, potentially leading to a decline in Bitcoin’s price.
Conclusion: The Road Ahead
As we stand at the crossroads of March 2025, the future of Bitcoin hangs in the balance. The bulls and bears are locked in a fierce battle, with the outcome uncertain. But one thing is clear: the crypto market is a rollercoaster ride, filled with twists, turns, and unexpected surprises. So, buckle up and hold on tight, because the journey is far from over.
The road ahead for Bitcoin is fraught with uncertainty, but it is also filled with opportunities. Whether the price moves up or down, there will be traders and investors looking to capitalize on the market’s volatility. The key to success in this environment is to stay informed, remain adaptable, and be prepared for any eventuality. By understanding the technicals, considering the broader picture, and keeping an eye on market sentiment and external factors, traders can make more informed decisions and navigate the crypto market’s twists and turns with greater confidence.
References
For further reading and a deeper dive into the technical analysis, you can refer to the following sources: