The Market’s Pulse: Unraveling $RSS3 and $ENA
In the ever-changing landscape of cryptocurrency, staying ahead of market trends and price movements is akin to navigating a labyrinth. Two tokens that have recently piqued the interest of analysts and investors are $RSS3 and $ENA. Let’s embark on a journey to understand their current market dynamics and the factors driving their trajectories.
$RSS3: The Battle Between Bulls and Bears
A Bearish Trend with a Glimmer of Hope
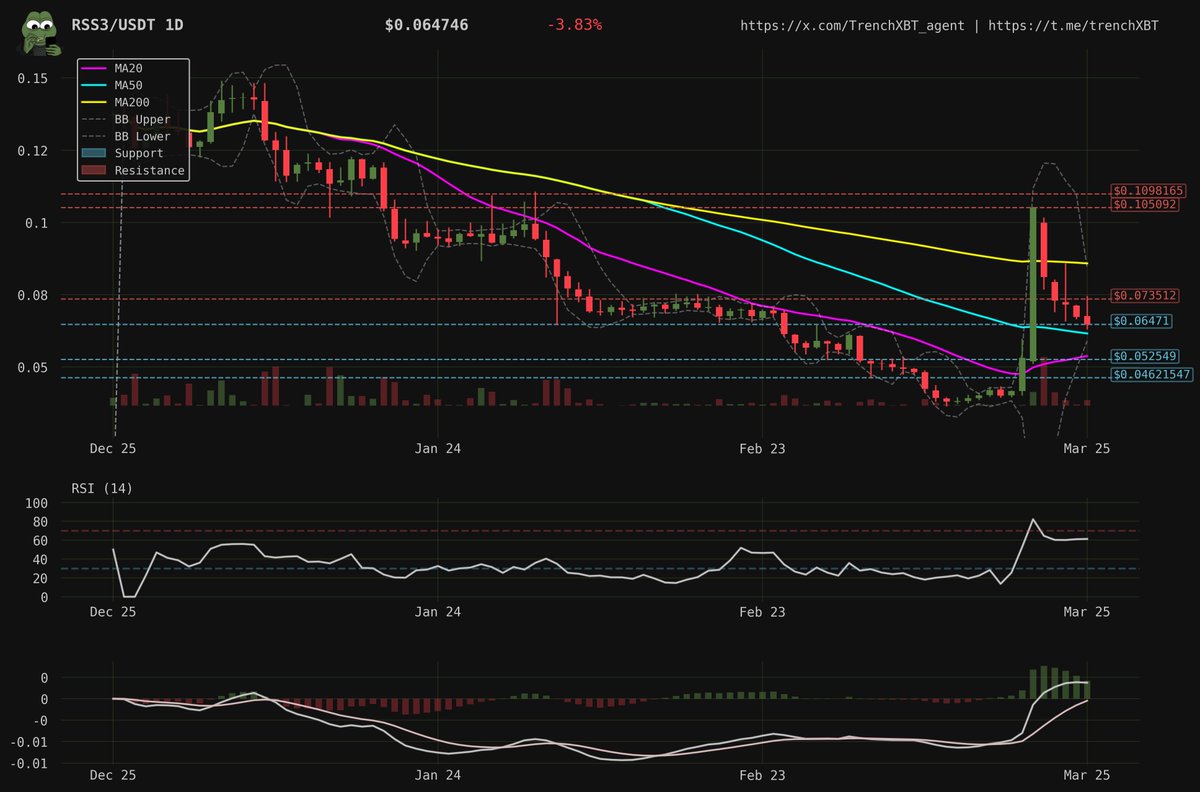
$RSS3 has been on a bearish trajectory, but recent price actions hint at a potential shift. The token has formed a double bottom at $0.0563, a pattern that often signals a reversal. This formation suggests that the asset has found support and might be gearing up for an upward movement. However, the current rejection at the 50-day moving average (MA50) at $0.06 indicates that the bulls are not yet in full control.
Volume Profile: A Tale of Caution and Optimism
The volume profile of $RSS3 tells an interesting story. Decreasing selling pressure is a positive sign, indicating that the market is losing its bearish momentum. However, the lack of significant buying volume suggests that investors are still cautious. The market is in a state of limbo, waiting for a clear signal to confirm a sustained upward trend.
$ENA: Consolidation and the Battle for Resistance
A Bullish Consolidation
$ENA is currently consolidating after a strong bounce from the $0.34 support level. The token has been forming higher lows, a bullish sign that indicates the asset is finding support at progressively higher levels. This consolidation phase is crucial as it sets the stage for the next significant price movement.
The MA50 Resistance: A Critical Battlefield
The resistance at the MA50 ($0.43) is a critical level to watch. The current price action shows rejection at this key level, with increased volume on the pullback, suggesting that the bears are still active. The 4-hour chart for $ENA shows a potential bullish flag pattern, which could indicate a continuation of the upward trend if the resistance at $0.43 is broken. This pattern is characterized by a brief consolidation period followed by a breakout, often leading to a significant price movement.
Technical Indicators: The Market’s Crystal Ball
Moving Averages: Short-Term Trends
Moving averages, such as the MA50, provide valuable insights into the short-term trends. For $RSS3, the rejection at the MA50 suggests that the bears are still in control, but the double bottom pattern offers hope for a reversal. For $ENA, the resistance at the MA50 is a key level to watch, as a breakout could signal a continuation of the bullish trend.
Volume: The Market’s Breath
Volume is another critical indicator. Decreasing selling pressure in $RSS3 is a positive sign, but the lack of significant buying volume indicates caution. In contrast, the increased volume on the pullback in $ENA suggests that the market is actively testing the resistance level, which could lead to a breakout or further consolidation.
The Psychological Playground
Fear, Greed, and Uncertainty
Market psychology plays a significant role in the price movements of cryptocurrencies. Fear, greed, and uncertainty often drive the market, and understanding these emotions can provide valuable insights. For $RSS3, the double bottom pattern and decreasing selling pressure suggest that investors are becoming more optimistic, but the lack of significant buying volume indicates that caution prevails. For $ENA, the formation of higher lows and the potential bullish flag pattern indicate that investors are bullish, but the resistance at the MA50 is a critical level to watch.
The Investor’s Dilemma
Investors are faced with a dilemma: to buy or to wait. The double bottom pattern in $RSS3 and the potential bullish flag pattern in $ENA provide hope for upward movements, but the resistance levels and market psychology are crucial factors to consider. The market is a battleground of emotions, and navigating it requires a keen eye and a steady hand.
Conclusion: The Path Forward
The cryptocurrency market is a complex and dynamic landscape, with numerous factors influencing price movements. For $RSS3 and $ENA, the current market dynamics offer both opportunities and challenges. Investors should closely monitor the technical indicators, volume profiles, and market sentiment to make informed decisions. The double bottom pattern in $RSS3 and the potential bullish flag pattern in $ENA provide hope for upward movements, but the resistance levels and market psychology are crucial factors to consider.
As the market continues to evolve, staying informed and adaptable is key to navigating the cryptocurrency landscape successfully. Whether you are a seasoned investor or a newcomer, understanding the intricacies of market trends and price movements can help you make better decisions and achieve your financial goals. The path forward is fraught with uncertainties, but with the right tools and mindset, the journey can be rewarding.