Crypto Market Insights: A Multifaceted Analysis of Bitcoin (BTC) on March 24, 2025
Introduction
Imagine the crypto market as a vast, ever-shifting landscape, where fortunes are made and lost with each twist and turn. As we stand on March 24, 2025, Bitcoin (BTC), the crypto titan, finds itself at a crossroads, with traders and analysts offering a smorgasbord of interpretations. Let’s embark on a journey to unravel the complex web of BTC’s current state, drawing insights from various sources to create a vivid, comprehensive picture.
The Bullish Narrative: Engulfing Patterns and Ascending Triangles
Bullish Engulfing and Rising Wedges
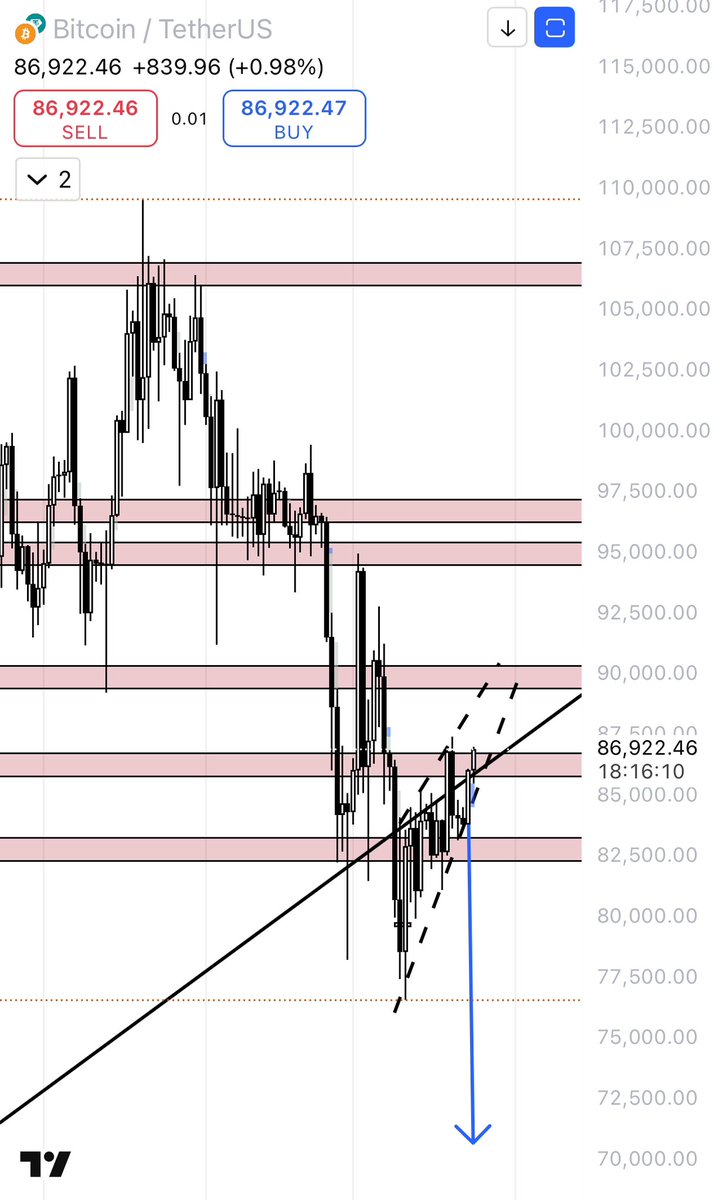
@crypto_trad1ng points out a bullish engulfing pattern on the daily chart, where BTC closes above the uptrend line, engulfing the previous day’s bearish candle. This pattern is like a bullish battle cry, signaling a potential trend reversal and a shift in market sentiment. However, a rising wedge pattern is also taking shape, a bearish reversal pattern that could cast a shadow over the bullish engulfing’s optimism. This paradoxical situation is like a game of tug-of-war between the bulls and bears, with neither side willing to let go.
Ascending Triangles and Ichimoku Clouds
@coingape_daily and @CoinGapeMedia both highlight that BTC is bouncing off an ascending triangle support, with the Ichimoku Cloud painting a bullish picture. Ascending triangles are like comfortable hammocks in the crypto market, continuation patterns that suggest the current trend will resume once the price breaks out of the triangle. The Ichimoku Cloud, a versatile indicator that defines support and resistance, as well as trend direction, is backing the bulls in this instance. A breakout with substantial volume could propel BTC higher, like a rocket launching into the crypto stratosphere, according to these sources.
The Bearish Counterpoint: Weak Indicators and Short Setups
On-Balance Volume (OBV) and Relative Strength Index (RSI)
@crypto_trad1ng also notes that the On-Balance Volume (OBV) is showing weak volume, and the Relative Strength Index (RSI) is bullish, but not overly so. These indicators are like canaries in the crypto coal mine, suggesting that while there is some buying pressure, it is not overwhelming, and the market may be vulnerable to a pullback.
Short Setups and Resistance Levels
@MandaCoin_X shares a 15-minute chart analysis, identifying a short setup for BTC/USDT. This analysis suggests that BTC may face resistance at certain levels, like a stubborn mountain climber refusing to budge. This situation makes it an opportune time for traders to consider short positions. Additionally, @neoweka provides a long/buy entry point for AUDIO/USDT, with a target price significantly higher than the entry point, indicating a potential opportunity for long positions.
Conclusion: Market Indecision and Opportunity
Navigating the Market Maze
The multifaceted analysis of BTC on March 24, 2025, reveals a market in a state of indecision, with bullish and bearish signals cancelling each other out. This situation is like standing at a crossroads, with each path leading to a different destination. This market indecision presents both challenges and opportunities for traders, as the market’s next move remains shrouded in mystery. To navigate this market maze, traders must remain vigilant, keeping a close eye on price action and key indicators, and being prepared to adapt their strategies like a chameleon changing its colors to blend into the market’s shifting landscape.
Sources